Relationship Mapping

A Guide for Public Health Partnerships

Relationship mapping is an increasingly popular tool for visualizing the relationships and systems that influence community health outcomes. Relationship maps help you visualize and analyze the structure, quality, and interactions between the people and organizations that make up the local public health system. The benefits include improved collaboration, enhanced decision-making, and better resource utilization among your community partners.

You can learn more below in our complete Guide.

An Introduction: Relationship Maps and Methods

Relationship mapping isn’t a single method or process. There are many different tools and frameworks for mapping relationships, each designed for a specific case use or organization. For example, you can map the relationships between individual people – or between organizations and companies – and each requires a different method. Here is a quick introduction to relationship analysis and mapping and the various ways it is used. 

To skip ahead to a section of interest, use the table of contents below and click a topic to scroll forward.

Table of Contents

What is Relationship Mapping?

Relationship maps visually represent the relationships and connections within a network or system of organizations, individuals, and communities.

These maps help organizations understand their relationships with partners, stakeholders, and other key players to manage better and leverage them effectively in the future. Public health leaders use these methods to strengthen the connections and partnerships that influence community health and well-being.

This is an example of a relationship map that shows who knows who among 24 different people. If a line connects two individuals, a relationship exists there. Gaps mean they don’t know each other.

relationship mapping

What are the Different Types of Relationship Mapping?

There are many different ways to apply relationship maps to your work. These four examples of varying relationship maps are not mutually exclusive and sometimes overlap. The type of relationship mapping you end up using can vary and blend depending on your context, goals, and audience for your results.

1. Stakeholder Mapping

A technique used to identify, analyze, and visualize the relationships between an organization and its stakeholders (a person, group, or organization that has an interest in or is affected by an initiative, project, or issue). This can include community organizations, government agencies, members of the public, and specific communities or neighborhoods. Stakeholder mapping helps organizations understand the interests, influence, and potential impact of their stakeholders.

2. Community Mapping

Community mapping is similar to stakeholder mapping, but focuses on mapping the relationships between individuals and organizations in a specific community or neighborhood. It is helpful for understanding the social, economic, and political landscape of a community to identify key influencers and potential partners in a specific geographic area.

3. Value Network Mapping

This relationship map is focused on identifying and visualizing the exchange of value between organizations, individuals, and communities. Mapping the flow of resources within a network helps organizations understand the dynamics at play and identify opportunities to leverage resources more effectively and strategically across your network of partners in the community.

4. Personal Network Mapping

Mapping personal relationships at the individual level provide insight into the way people receive support, share resources and spread information. Often used by epidemiologists to understand how diseases spread across communities, this mapping focuses on learning how social relationships influence socioeconomic factors like poverty, health, education, and more. This allows organizations to design more effective, evidence-based community interventions.

5. Contact Tracing

Contact Tracing is a well-established public health practice to track disease spread through communities. It is essentially a form of connection mapping, as it relies on identifying connected individuals in terms of physical proximity. This helps epidemiologists track how diseases like COVID-19 spread from person to person and allow them to intervene and halt the chain of transmission.

How is Relationship Mapping Used in Public Health?

This method of analysis is used in many different ways within public health. However, in most cases, it falls into two primary categories: epidemiological research on how diseases spread through communities and system mapping efforts to understand, track, and strengthen community health. It is this second case use we will focus on in this guide.

Disease Tracking and Epidemiology

Traditionally, the most common use of relationship maps was for epidemiology and contact tracing. However, as the field as shifted from focusing on disease to consider upstream determinants of health, relationship mapping has become a valuable tool for understanding the broader relationships and systems that influence community health.

Systems Change and Community Health

Increasingly, public health leaders use relationship maps and methods to visualize and understand their local public health system. By mapping relationships between all those who influence health outcomes in a community, public health departments and hospitals can identify new opportunities for collaboration and coordination, improve decision-making and resource allocation, and demonstrate their impact on stakeholders in the community. 

Let’s dig into this application for mapping relationships, beginning by exploring the need for this methodology to understand and strengthen local public health systems. Then we will discuss why a network approach is the best way to frame this kind of analysis and see a bird’s eye view of the system.

Understanding the Need for Relationship Mapping

As collaboration becomes more and more essential in public health and philanthropy, there is a growing understanding of the importance of our connections. Visualizing the systems and relationships that impact community health is a powerful way to discover new opportunities and manage your collaboration strategically.

Here are the four biggest benefits we see among those mapping relationships as part of their work to improve community health.

Visualizing and Understanding Systems and Networks

Creating maps of relationships is essential for those working to achieve systems change in communities. Visualizing all the entities within a system and how they interact is a critical first step toward shifting the system toward more equitable outcomes. Identifying key players and leverage points and the pattern of connections across the system can help generate innovative ideas and strategies for more equitable and resilient collaboration.

In this example, the Public Health Department can see its position within the broader network of partners. They can also measure the quality of its connections and strategize how to strengthen ties and fill gaps.

Social Network Analysis

Demonstrating Your Shared Community Impact

Many community partnerships and collaborative efforts are funded by grants or specific programs with evaluation requirements. Relationship maps are a powerful, visual way to demonstrate the impact of your partnerships and collaboration across the community. You can show how the network has grown and become more connected, changed how they share resources and information, and how the network itself perceives its success and performance.

Developing Data-Driven Collaborative Strategies

Relationship mapping provides relational data to identify gaps and areas for focus within your network. This information, when compared to your goals, forms the basis of a collaborative strategy for the future. Use insights identified from your relationship maps, like redundant relationships, gaps in connectivity, shared resources, and key players to create an action plan that strengthens your network of relationship in the future.

Prioritizing Diversity, Equity, and Inclusion in your Relationships

It is increasingly recognized that community collaboration must be rooted in principles and values of equity and inclusion to be most effective. A map of your relationships in the community can help you identify who is missing from the table so you can reach out and involve marginalized or isolated communities and partners in your work. Often, these groups have critical insight in the form of lived experiences and knowledge that can help create more effective interventions and programs.

Taking a Network Approach

There are two distinct approaches to relationship mapping; they can be thought of as ‘bottom-up’ vs ‘top-down’ approaches. The bottom-up approach focuses on your direct relationships: You might write down a list of all the groups you work with and draw a line between you and them, resulting in a ‘hub-and-spoke’ model with you at the center. This is the approach most groups use for mapping their connections and partnerships because it is the simplest and easiest to implement. However, it lacks critical information about how each partner works together.

The top-down approach takes a bird’s eye view of the ecosystem of which you are a part. Instead of focusing on your direct relationships with your partners, this approach focuses on the entire network of partnerships. It allows you to understand your relationships, as well as the relationships of your partners in the community. This mapping type is grounded in social network analysis, a form of analysis rooted in network science and data analysis. Here are some reasons to take a network approach when mapping relationships instead of focusing on those you know and collaborate with personally.

bottom-up relationship mapping example

A bottom-up relationship map. It only shows the relationships you have direct knowledge of.

top-down relationship mapping example

A top-down relationship map. It shows all of the relationships across the entire network or system

Differences Between a CRM and a CPRM

Many organizations use a CRM system to track their relationships with partners in the community. However, a CRM (customer relationship management) software only tracks direct relationships – who your organization knows and collaborates with. It cannot provide insight about the way your partners are embedded and interacting within the system. 

In this sense, a CRM only helps create bottom-up relationship maps. It would help if you had a top-down relationship map representing the complexity across your entire ecosystem of community partners.

A CPRM (community partner relationship management) tool measures both your direct partners, and all those they connect to as well. This additional layer of insight exponentially increases the usefulness of relationship mapping, enabling you to tap into the resources, insight, and experience of a much broader range of organizations in the community.

Taking a Bird’s Eye Perspective of the Network

A network approach identifies gaps and insights only possible when you look at the entire network. For example, looking across the entire network allows you to identify gaps between key partners who would benefit by collaborating or sharing resources. It also allows you to pick out threats or weaknesses, like redundant partnerships that are draining resources and time, to be more agile and efficient while collaborating. A focus on your partners without the broader network ignores all of these insights and discoveries.

Leverage Resources and Relationships Across the System

The value of your relationships comes from the information, resources, insight, and experience they provide. Taking a network approach to visualize your relationships allows you to tap into the networks of all your partners and your own. You can identify previously untapped resources available to others in your network, like staffing, funding, time, expertise, or volunteers. Inventorying resources can improve allocation across the entire system rather than just your relationships.

Get our free Network Strategy Guide!

Our Network Strategy worksheet includes all the main factors you should consider while creating a strategic plan for your coalition or network of community partners. 

It includes a link to watch our complete video walkthrough of the worksheet with our CEO and Network Scientist, Dr. Danielle Varda, along with a PDF guide on how to fill out the worksheet. 

Public Health Stories From the Field

Need help brainstorming ideas for using this approach in your local public health system? We’ve worked with dozens of health departments and community organizations to do just that. 

Here are a few stories and examples from the field to spark some inspiration and discussion with you and your partners.

1. Mapping a Rural Public Health System

A public health department in a rural area was facing numerous health challenges, including high rates of chronic diseases and limited access to healthcare. The department recognized that addressing these challenges required a collaborative approach that involved multiple partners spread across a vast rural area, including community-based organizations, healthcare providers, and local government agencies. To understand the rural public health system, the department used social network analysis to map out all the partners and their relationships to one another, with a focus on place-based patterns.

The exercise revealed several key findings. The department discovered that there were several partners who were not engaged in public health efforts, and that many of the partners who were engaged had limited capacity to contribute. In addition, the department identified areas where collaboration could be improved, including better communication, shared data and resources, and joint planning and implementation. They focused on using tele-health technology and virtual meetings to increase several key partners’ ability to engage and collaborate, strengthening the overall rural public health system.

2. Addressing Urban Challenges with a Relationship Map

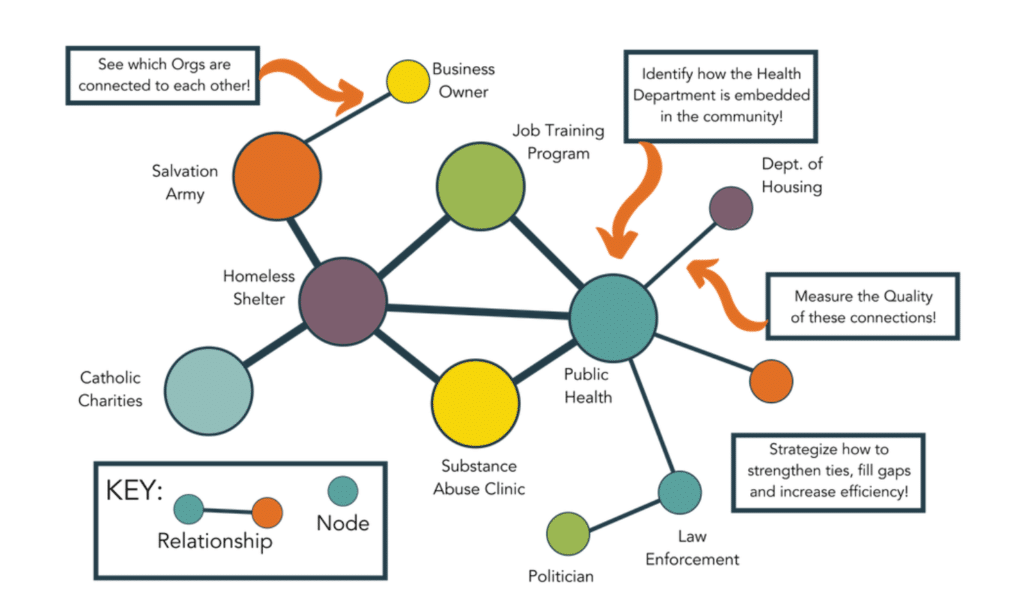
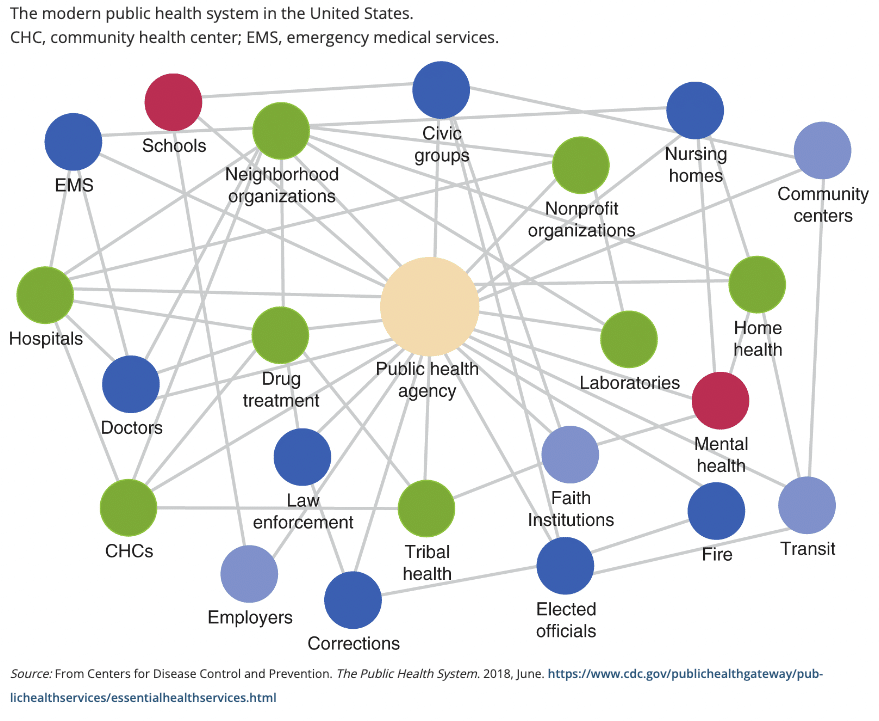
A local health department in an urban area decided that they needed to leverage a systems approach to address some of the most pressing health issues in the metro area, including growing health disparities that reflected inherent socio-economic inequities. While implementing the MAPP Framework (Mobilizing for Action Through Planning and Partnership), a systems-based approach for community health improvement, they needed to assess their local public health system. To better understand the complex network of stakeholders and partners involved with these issues, the department created a map of their connections to visualize the relationships between partners.

The process identified more than 100 different entities that had a role to play in shifting the discussion and power dynamics in the community. Their map of the local system showed that many partners had a significant influence on health outcomes, including local government agencies, healthcare providers, and community-based organizations. The department also identified several key partners who impacted health outcomes the most, such as large employers, schools, and transportation providers. They became the department’s critical partners in new initiatives to reduce unemployment, improve education access, and eliminate barriers to transportation to improve the social determinants of health. 

3. Relationship Mapping in a Suburban Public Health Department

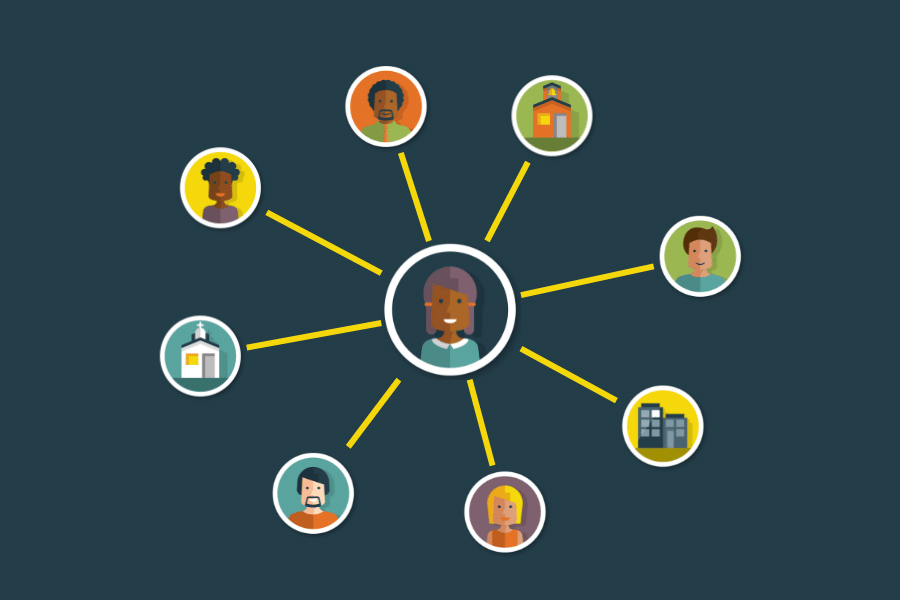
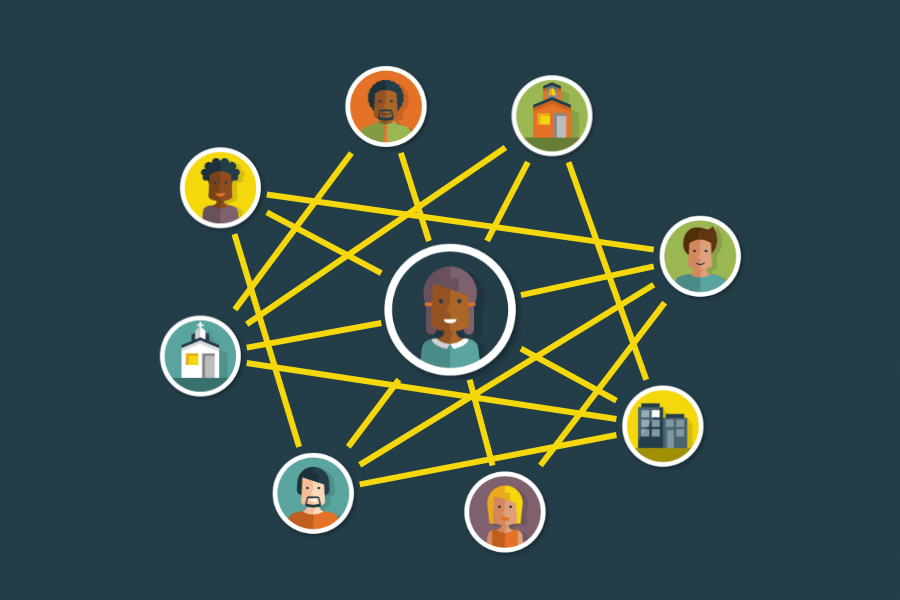
A public health department in a suburban area was facing significant public health challenges, including high rates of mental illness and substance abuse, much of which went unaddressed and untreated. They decided to create a new community coalition with community partners to raise awareness of the growing issue, reduce stigma in the community, and share resources for people to seek help. To better understand the relationships between community-based organizations and public health partners that might join the new coalition, the department used relationship mapping to understand the present landscape.

The mapping exercise revealed several barriers to collaboration, including conflicting priorities, lack of trust, and limited communication and coordination. However, it also identified several organizations that were passionate about increasing access to mental health and substance abuse treatment programs, including a Community Foundation that had funds available. They used the information to assemble a steering committee of dedicated and connected leaders and secure a grant from the local foundation to fund the coalition for the next two years while they evaluate and demonstrate their impact.

Tools for Mapping Relationships

There are many different tools available to make the process easier. Free options like Kumu and Gephi don’t come with any costs. However, they are limited in the insight they provide and require you to collect, clean, and upload your data by hand. More advanced tools come with a price tag. Still, the results are usually worth the initial investment in terms of increased insight, time and resources saved, and the overall impact on community health.

One of the most popular tools among public health professionals is PARTNER CPRM; a community partnership relationship management tool. Here’s an explanation of how it and several other options work, what features they include, and the specific benefits they provide to users.

Introduction to PARTNER CPRM

PARTNER [the Program to Analyze, Record, and Track Networks to Enhance Relationships] is a social network analysis platform that includes a CPRM tool for mapping and visualizing relationships.

Using the tool’s survey builder, you can collect information from your network of partners without any integrations or data cleaning. Visually explore your results and leverage our Insights Library to generate actionable insights. Create customized reports, briefs, and partner profiles to share your relationship maps and findings.

PARTNER CPRM Network Mapping Features

Topical Survey Templates: Save time by using one of 15+ survey templates designed for specific areas of focus, like the MAPP Partnership Assessment Tool, early childhood partnerships, HIV providers, and more.

All-in-One Tool: Design, pilot, and send surveys, upload and clean data, visualize and analyze results, and create custom reports with maps and graphics in our single platform. No integrations or data cleaning is ever required.

Network Analyzer: Explore your data visually in the Network Analyzer. Generate maps quickly to identify patterns, gaps, and opportunities in your network. Save graphics with the click of a button to add to reports or presentations.

GIS Map Layers: Generate place-based insights by viewing your relationships on a geographic map. Add additional map layers with health or demographic data to identify populations or communities currently unrepresented in your network.

Report Builder: Create reports with your most important network maps, survey data, findings and action steps to share with the members of your network, funders, and other stakeholders in the community.

Network Member Profiles: Make your findings and insight accessible to your community partners. Send them their profile with all their network maps, survey responses, trust and value scores, and other data they can use to demonstrate their impact to stakeholders and improve how they collaborate.

PARTNER is just one of the numerous options available to create a relationship map. Still, it is the best option for those working specifically with community partners to achieve shared social impact. The ability to easily share data and communicate findings with the community is one of the most valuable features – especially considering the critical role that networks play in sharing information and best practices.

Click here to learn more about PARTNER CPRM.

How Do you fill out a relationship map?

Ready to try creating your own relationship map? To create a simple map, all you need is a pen and paper. Follow these steps to get started.

1. Decide on the purpose and scope

First, make sure you know why you are relationship mapping. Determine what it is you want to focus on – what kind of relationships are relevant? For example, you may be interested in who knows who in the community, or you may be interested specifically in who is collaboratively actively. Make sure you define what constitutes a ‘relationship’.

2. Create a list of key stakeholders

Identify the individuals or organizations that are relevant to the issue at hand. If you are mapping relationships related to a program, think about those who fund it, run it, influence it, are impacted by it, or otherwise have a vested influence in how it is operated and how well it works. Make a point to consider unlikely partners or those tangentially connected.

3. Map the relationships between stakeholders

On a pieces of paper, draw a circle for each stakeholder and label them. Begin drawing lines to connect each set of stakeholders who know one another or collaborate. You can do this from memory, but this is likely to be inaccurate. You can also send a simple survey to your partners and ask them to select those they know from a list. Use this information to draw your connections.

If you have data about the quality of these relationships, you can use different colored lines to visualize these differences. For example, if you know the relationship is positive, use a green line. If the relationship is neutral, use orange. If it is negative or hostile, use red. This gives you another way to analyze your relationship later.

If you have different ways of categorizing stakeholders, you can use different colors or size nodes differently as well. For example, you can visualize the level of influence by node size, or show the sector or focus area based on colors (green=public health, red=healthcare, yellow=food and nutrition, etc.).

4. Analyze the relationships

With your nodes connected, you can take a step back and look at the complete network. Evaluate the strengths and weaknesses within the map and identify potential areas for improvement. For example, you may see gaps in the map where there is space for new partnerships, or you may recognize key influencers who are well-connected and can help you reach your goals.

Here are some other questions you should ask and reflect on while analyzing your relationship map:

  • Does the collaborative have all the essential partners at the table?
  • If not, who is missing that should be involved? 
  • Who are the most well-connected and centrally located members of the system?
  • Are there any areas where additional/fewer partners would help strengthen the collaboration?
  • Does the system have the best makeup of roles/positions in the network? Are some roles lacking in representation?
  • Is there an adequate level of involvement from the members of the system?
  • What steps can be taken to elicit more active involvement and engagement from system members?
  • Does the collaborative have a lot of member turnover within the partner organizations?
  • How does the quality of relationships vary in terms of trust, value, power, and connectivity?

5. Use relationship mapping results to inform action

Use the data and insights you gather to inform and guide your future collaborative action. Some example strategies you might choose include creating new relationships, focusing on building trust between key partners, addressing gaps or reaching out to isolated members of the network, and reducing the number of redundant relationships in the network.

Frequently Asked Questions

Over the past decade, we’ve helped dozens of public health departments map their relationships in the community. Here are some common questions we get related to relationship mapping in the context of public and population health. If you have an additional question to ask, leave a comment at the bottom of the page and a member of our team will get back to you!

A: Social network analysis is an example of a relationship map methodology that uses nodes connected by lines to visualize relationships within a system. SNA uses various network metrics, like centrality and density, to characterize the quality of the connections and relationships within the overall network. This allows networks to be measured and tracked quantitatively to assess how it is changing and evolving over time to better meet the goals of its members.

A: There are many different types of relationship maps because there are many different types of relationships. For example, a family tree is a simple relationship map that focuses on mapping family relationships. A stakeholder relationship map visualizes the connections between various stakeholders on a single issue area. For example, a stakeholder map could analyze the way various members of the community work together to plan a local festival or event.

A: Relationship maps are important because they visualize the invisible connections and perceptions that often influence our progress and outcomes. Without insight into the trust, power, and influence among your partners, it is impossible to effectively leverage and strengthen those qualities among your connections. Relationship maps make these factors tangible so you can begin strategizing and incorporating them into your plans and tactics.

A: At a basic level, relationship mapping visualizes the connections between individuals and organizations by drawing lines between nodes. However, we can create more insight by altering the size of node and the thickness of connecting lines to demonstrate factors like trust and value between partners, the frequency and intensity of interaction, and how central an individual is within the broader network. These quality metrics provide the most valuable insights from relationship maps.

A: There are many options out there for relationship mapping tools that use social network analysis. There are free options like Kumu and Gephi, however they work best for researchers, have a steep learning curve, and require you to manually collect data, clean it, and upload it to map a relationship map.

Our recommendation for a relationship mapping tool is PARTNER CPRM. As a community partner relationship management platform, researchers at CU Denver designed it specifically for public health departments to map, understand and strengthen the local system of partners in their community. Click here to see examples of research and evaluation conducted using PARTNER CPRM. You can also click here to request an interactive web demo with our Partnerships Team.

A: Relationship mapping has many benefits for public health departments. Epidemiologists can use relationship maps to understand and track the spread of disease and behavior among individuals. Strategists and planners can use it to visualize their local public health system. Through this process, they can identify gaps, eliminate redundancies, improve partnerships, and create a strategy for the future. These maps are also a powerful way to demonstrate the impact of relationship-building efforts. Including them in grant reporting is a great way to show the effects of your work in the community by creating new partnerships and strengthening existing connections.

Relationship Maps Can Help You Build Better Community Partnerships and Strengthen Your Collaboration

As you can see, relationship maps are a powerful source of insight for those engaged in active collaboration in the community. Access to insights like who knows who in a given area, how power is distributed across the system, or what resources are available among partners makes partnerships more effective while saving time and resources devoted to building and managing them. While many tools are available to do this kind of work, we recommend using PARTNER CPRM, the only option designed specifically for public health and community health impact. Click here to contact our team and learn more.

Additional Information and Links

Here are some additional resources, websites, and tools to help you learn more and get started. You can also visit our Network Leadership Resource Library to see all our articles, infographics, webinars, and research related to building, managing, and evaluating cross-sector community partnerships and networks. We hope you found this guide informative and helpful for your needs. If you have feedback or suggestions for the community, please comment below with your thoughts.

Authors and Acknowledgments

Connect with our Team!

Contact the VNL team to demo PARTNER™ or discuss a research or evaluation project. We can help you learn more about our services, help brainstorm project designs, and provide a custom scope based on your budget and needs. We look forward to connecting! 

Email our team: hello@visiblenetworklabs.com

Send a message: Contact Us Here

Additional Resources

Ecosystem Mapping and tracking
Webinars

Webinar: Ecosystem Mapping and Tracking with PARTNER

https://youtu.be/1EpAPAqmjSQ Ecosystem Mapping and Tracking Can Teach You a LOT. An ecosystem consists of all the organizations, individuals, programs, and other entities that interact and interconnect to affect the outcomes of your work. For example, the healthcare ecosystem includes organizations like hospitals, clinics, public health

Read More »
Benefits of PARTNER CPRM

Ecosystem Mapping: A Tool to Strengthen Systems and Impact

Ecosystem mapping is an excellent tool for those taking a systems or network approach in their work. Whether you aim to improve community health, education, and other social issues, you will benefit by understanding the systems influencing your approach. By visually understanding how the entities

Read More »
Benefits of using a CPRM
Blogs

Benefits of Using a CPRM to Manage Your Network of Partnerships

The Many Benefits of Using a CPRM… A Community Partner Relationship Management System allows you to track, manage & leverage your interconnected network of partnerships. Whether you’re a University managing community partnerships, a Government Affairs Department tracking your policy ecosystem, a CPRM offers many benefits

Read More »
Relationship Budgeting
Blogs

Relationship Budgeting: Building Networks with Intent

A bigger network is a better network… right? That’s what most of us learn our entire lives. More friends, partners and network members provide more ideas, more opportunities, and more connections in turn. More is better… or is it a problem? When asked what’s limiting

Read More »
Blogs

Why Most Network Maps Miss the Point

Network maps are becoming more popular than ever, and it’s not surprising at all. People are realizing more than ever how much social connections matter and influence outcomes. Network maps are an easy way to visualize your relationships, and begin analyzing a network of partners.

Read More »