PARTNER CPRM™:
How It Works
PARTNER™ makes invisible networks visible by mapping complex connections and analyzing relationship dynamics. Whether tailoring healthcare interventions, strategically allocating grants, or aligning diverse stakeholders, PARTNER CPRM™ empowers organizations to drive meaningful impact.
Implementing PARTNER CPRM™ in Four Steps
Our unique approach fosters a continual cycle of collaboration and strategic planning. Keeping your network data fresh enables regularly updating your strategies and adapting to community changes for ongoing collaboration and alignment. Here’s how it unfolds in five steps which can be repeated on weekly, monthly, or quarterly cycles.
1. Upload Your Network Members
Upload contact information, GIS data, and other details like sector or focus area.
2. Send a Survey to Collect Data
Schedule or send emails to collect and capture data after partner interactions.
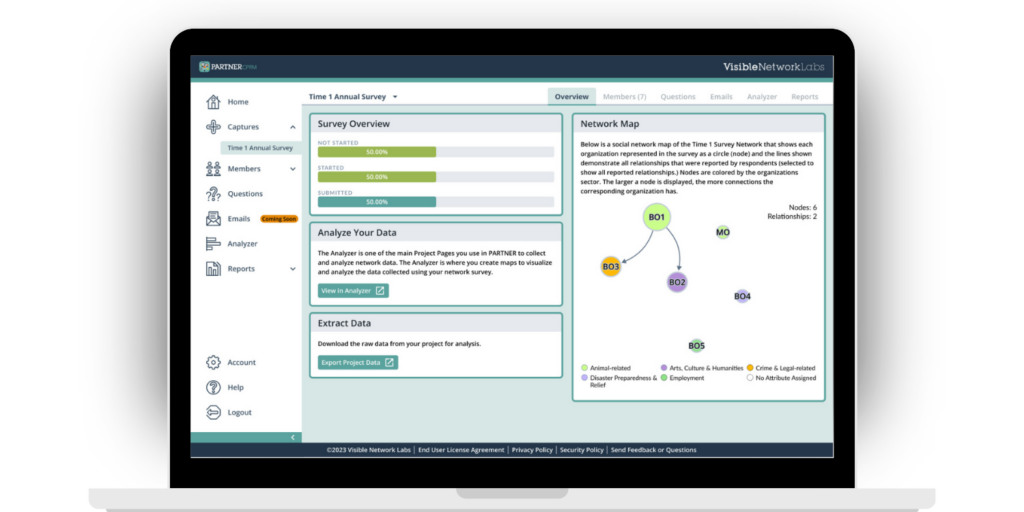
3. Map and Analyze Your Network
Translate your date into actionable insights using our analysis tools.
4. Build Reports and Dashboards
Democratize data and share insights with the Report Builder and Member Profiles.
Map, measure, and strengthen your ecosystem in four steps
Follow the journey from managing members to sharing dashboards. Click steps, use ◀︎ ▶︎ keys, or drag the scrubber.
1 · Manage Members with Advanced Filters
Segment your ecosystem using sector, role, and engagement filters—then export a subnetwork CSV to coordinate outreach or launch a targeted survey.
| Name | Sector | Role | Engagement |
|---|---|---|---|
| No filters applied yet. | |||
2 · Send a Survey to Collect Relationship Data
Capture who works with whom, on what, and how partners rate trust, perceived value, and contributions. Use logic to tailor questions and schedule delivery by email.
| Partner | Never | Sometimes | Often |
|---|---|---|---|
| River Valley Housing | |||
| Transit Together | |||
| County Health |
3 · Map & Analyze Your Network
See your ecosystem, find brokers and connectors, overlay GIS base layers, and track network health with validated metrics.
4 · Share Your Insights with Dashboards & Profiles
Publish public dashboards and member profiles to align partners, increase transparency, and report impact. Highlight key players and export a board-ready summary.
Engagement by Sector
| Member | Degree | Betweenness | Closeness | Trust | Value |
|---|---|---|---|---|---|
| Healthy Futures Coalition | 0.78 | 0.61 | 0.66 | 4.4 | 4.2 |
| Transit Together | 0.74 | 0.68 | 0.63 | 4.1 | 4.0 |
| River Valley Housing | 0.59 | 0.32 | 0.55 | 4.0 | 3.8 |
| County Health | 0.57 | 0.30 | 0.51 | 4.2 | 4.1 |
| WorkNow Center | 0.55 | 0.28 | 0.50 | 3.9 | 3.7 |