Network maps are becoming more popular than ever, and it’s not surprising at all. People are realizing more than ever how much social connections matter and influence outcomes. Network maps are an easy way to visualize your relationships, and begin analyzing a network of partners. Yet most network maps are missing the point: their usefulness is limited, and they’re more hype than help. Why do most network maps miss the point? To put it simply, most maps assume that all relationships are equal. Without understanding the quality of relationships, in addition to their structure, a network map doesn’t tell us very much.
A Network Map is a Visual Model of Interconnected Relationships
A network map is a visual model of a set of interconnected relationships. They include a series of nodes, which represent distinct entities, and ties that represent a connection between them. These relationships or ties can be between people, organizations, ideas, or whatever you come up with! In network analysis, we use the map as a model for understanding how partnerships form structurally. They’re great for showing who is working with who in a given area. However, that’s where their usefulness normally ends.
Most Network Maps Assume All Relationships are Identical
 The biggest problem with most network maps comes from the way they treat relationships. Almost always, the ties in a network all appear the same: a basic line, with no qualifiers. Either the relationship exists, or it doesn’t – beyond that there is no detail.
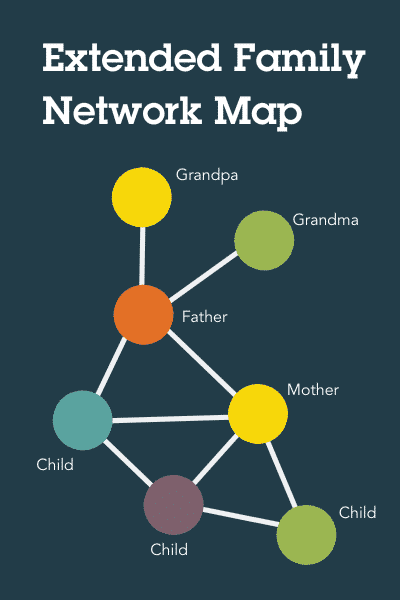
For example, look at the network map on the right, which depicts the relationships within an extended family. As you can see, according to this map, the relationship between the parents is identical to the relationship between the grandmother and grandson.
Obviously, these relationships are extremely different – they have different levels of trust, perceptions of authority, and a context that is key. If you used this model as a guideline, and treated all the relationships as if they were equal, problems will inevitably rise.
You Need to Measure the Quality of Relationships too!
Network maps show the structure, or arrangement of relationships, but they rarely visualize the quality of those relationships. Nearly a decade ago, we set out to build a better program that would provide people better insights on relationship quality. Through interviews, surveys and research, we created numerous metrics and scales to help qualify a relationship in an network. Some of these relationship quality metrics include:
- Trust (Mission alignment, openness to communication, reliability)
- Value (Resource contribution, power & influence, level of involvement)
- Intensity of Collaboration (collaboration, coordination, integration)
- Perceptions of Success (questions on outcomes & processes)
- Frequency of Interaction (daily, weekly, monthly, annually)
Now look at the images on the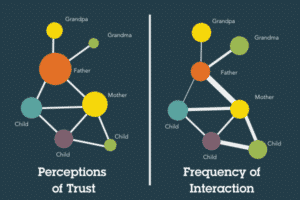 right. It’s the same family network map, however now we’ve included four different maps. They show perceptions of trust and value, along with the intensity and frequency of interactions.
Here we can clearly see that not all relationships are identical in a network – every single metric varies from relationship to relationship. Now that we know how they differ, we can make more informed strategic decisions to improve our collaboration and outcomes.
The Best Network Maps Visualize Structure AND Quality!
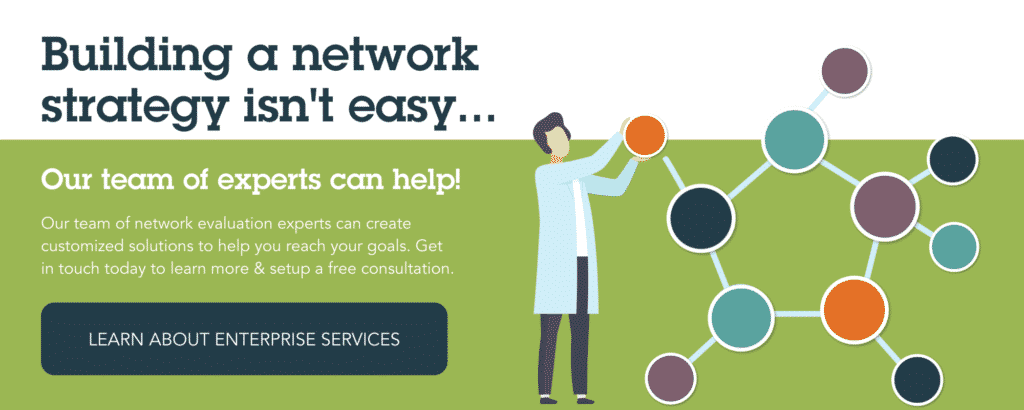
While you can learn a bit from structure alone, the most valuable insight comes from adding quality metrics. If you assume and act as though all relationships are the same, you’re setting yourself up for failure. In order to make strategic decisions about how to structure a network, we have to understand where there is trust and value, and how people are interacting. Otherwise, we’re only getting part of the story – and our outcomes will show it. Want to start gathering this kind of data? Look into PARTNER – the only platform to measure these kind of quality metrics!