Social Network Analysis 101: Ultimate Guide
Comprehensive Introduction for Beginners
Social network analysis is a powerful tool for visualizing, understanding, and harnessing the power of networks and relationships. At Visible Network Labs, we use our network science and mapping tools and expertise to track collaborative ecosystems and strengthen systems change initiatives. In this Comprehensive Guide, we’ll introduce key principles, theories, terms, and tools for practitioners framed around social impact, systems change, and community health improvement. Let’s dig in!
Learn more and get started with the tools below in our complete Guide.
Table of Contents
You can read this guide from start-to-finish or use the table of contents to fast forward to a topic or section of interest to you. The guide is yours to use as you see fit.
Introduction
Let’s start by reviewing the basics, like a definition, why SNA is important, and the history of the practice. If you want a quick intro to this methodology, download our Social Network Analysis Brief.
Definition of Social Network Analysis (SNA)
Social Network Analysis, or SNA, is a research method used to visualize and analyze relationships and connections between entities or individuals within a network. Imagine mapping the relationships between different departments in a corporation. The outcome would be a vivid picture of how each department interacts with others, allowing us to see communication patterns, influential entities, and bottlenecks
The Importance of SNA
SNA is a powerful tool. It allows us to explore the underlying structure of an organization or network, identifying the formal and informal relationships that drive the formal processes and outcomes. This insight can enable better communication, facilitate change management, and inspire more efficient collaboration.
This methodology also helps demonstrate the impact of relationship-building and systems change efforts by documenting the changes in the quality and quantity of relationships before and after the initiative. The maps and visualizations produced by SNA are an engaging way to share your progress and impact with stakeholders, donors, and the community at large.
Brief Historical Overview of SNA
The concept of SNA emerged in the 1930s within the field of sociology. Its roots, however, trace back to graph theory in mathematics. It was not until the advent of computers and digital data in the 1980s and 1990s that SNA became widely used, revealing new insights about organizational dynamics, community structures, and social phenomena.
While it originated as an academic research tool, it is increasingly used to inform real-world practice. Today, it is used in a broad variety of industries, fields, and sectors, including business, web development, public health, foundations and philanthropy, telecommunications, law enforcement, academia, and systems change initiatives, to name a few.
Fundamentals of SNA
SNA is a broad topic, but these are some of the essential terms, concepts, and theories you need to know to understand how it works.
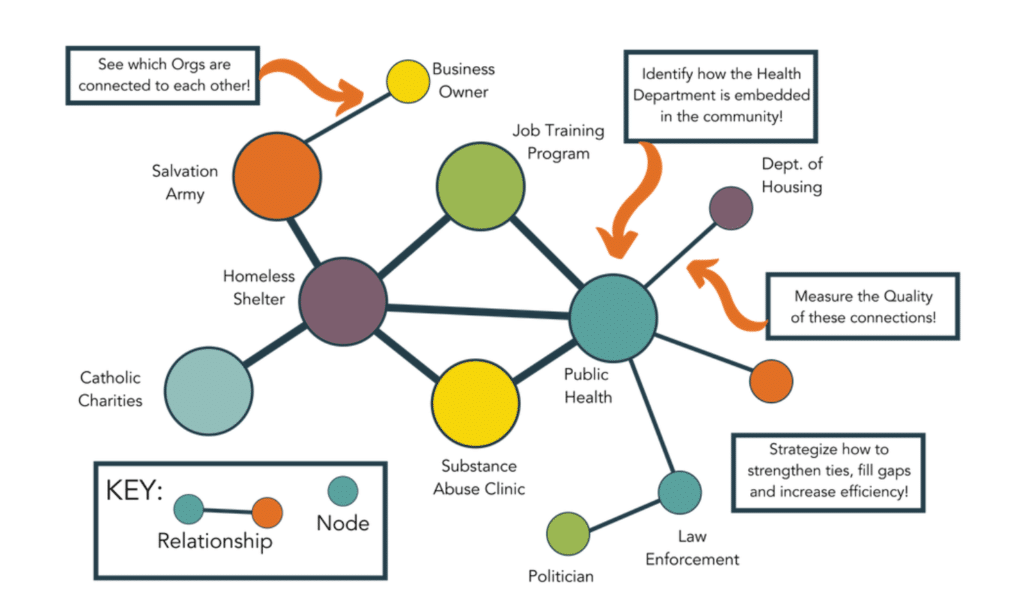
Nodes and Edges
In SNA, nodes represent individuals or entities while edges symbolize the relationships between them. For example, in an inter-organizational network, nodes might be companies, and edges could represent communication, collaboration, or competition.
Network Types
Different types of networks serve different purposes. ‘Ego Networks’ focus on one node and its direct connections, revealing its immediate network. ‘Whole Networks’, on the other hand, capture a broader picture, encompassing an entire organization or system. Open networks are loosely connected, with many opportunities to build new connections, ideal for innovation and idea generation – while closed networks are densely interconnected, better for refining ideas amongst a group who all know each other.
Network Properties
Properties such as density (the proportion of potential connections that are actual connections), diameter (the longest distance between two nodes), and centrality (the importance of a node within the network) allow us to understand the network’s structure and function. Metrics also can measure relationship quality across the network, like our validated trust and value scores.
Dyadic and Triadic Relationships
Dyadic relationships involve two nodes, like a partnership between two companies. Triadic relationships, involving three nodes, are more complex but can offer richer insights. For instance, it might show how a third company influences the relationship between two others, or which members of your network are the best at building new relationships between their peers.
Homophily and Heterophily
Homophily refers to the tendency of similar nodes to connect, while heterophily is the opposite. In a business context, we might see homophily between companies in the same industry and heterophily when seeking diversity in a supply chain. Many networks aim to be diverse but get stuck talking to the same, similar partners. These network concepts underly many strategies promoting network innovation to avoid group-think among likeminded partners.
Network Topologies
Lastly, the layout or pattern of a network, its topology, can reveal much about its function. For instance, a centralized topology, where one node is connected to all others, may indicate a hierarchical organization, while a decentralized topology suggests a more collaborative and flexible environment. This is also referred to as the structure of the network. Read more.
Theoretical Background of SNA
Many different theories have developed to explain how certain network properties, like their topology, centrality, or type, lead to different outcomes. Here are several key theories relevant to SNA.
Strength of Weak Ties Theory
This theory postulates that weak ties or connections often provide more novel information and resources compared to strong ties. These “weak” relationships, which may seem less important, can serve as important bridges between different clusters within a network. Read more.
Structural Hole Theory
This theory posits that individuals who span the structural holes, or gaps, in a network—acting as a bridge between different groups—hold a strategic advantage. They can control and manipulate information and resources flowing between the groups, making their position more influential. Read more
Small World Network Theory
This theory emphasizes the interconnectedness of nodes within a network. It suggests that most nodes can be reached from any other node through a relatively short path of connections. This property leads to the famous phenomenon of “six degrees of separation,” indicating efficient information transfer and connectivity in a network.
Barabási–Albert (Scale-Free Network) Model
This model suggests that networks evolve over time through the process of preferential attachment, where new nodes are more likely to connect to already well-connected nodes. This results in “scale-free” networks, where a few nodes (“hubs”) have many connections while the majority of nodes have few.
Data Collection and Preparation
Every network mapping begins by collecting and preparing data before it can be analyzed. This data varies widely, but at a basic level, they must include data on nodes (the entities in the network) and data on edges (the lines between nodes representing a relationship or connection). Additional data on the attributes of the nodes or edges add more levels of analysis and insight but are not strictly necessary.
Primary Methods for Collecting SNA Data
This can be as simple as conducting interviews or surveys within an organization. The more complex the network, the more difficult it is to collect good primary data: If you have more than 5-10 partners, interviews and surveys are hard to conduct by hand.
Network survey tools like PARTNER collect relational data by asking respondents who they are connected to, and then asking them about aspects of their relationships to provide trust, value, and network structure scores. This is impossible to do using most survey software like Google Forms without hours of cleaning by hand.
Response rates are an important consideration if using surveys for data collection. Unlike a typical survey where a small sample is representative, a network survey requires a high response rate – 80% and above are considered the gold standard.
In an inter-organizational context where surveys are impossible, or you cannot achieve a valid response rate, one might gather data through business reports, contracts, or publicly available data on partnerships and affiliations. For example, you could visit an organization’s website to note who they list as a partner – and do the same for others – to generate a basic SNA map.
Secondary Sources of SNA Data
Secondary sources include data that was already collected but can be used again, often to complement your use of primary data you collect yourself. This might include academic databases, industry reports, or social media data. It’s important to ensure the accuracy and reliability of these sources.
You can also conduct interviews or focus groups with network members to add a qualitative perspective to your results. These mixed-method SNA projects provide a great deal more depth to their network maps through their conversations with numerous network representatives to explore deeper themes and perspectives.
Ethical Considerations in Data Collection
When collecting data, it’s crucial to ensure privacy, obtain necessary permissions, and anonymize data where necessary. Respecting these ethical boundaries is critical for maintaining trust and integrity in your work.
Consider also how your SNA results will be used. For example, network analysis can help assess how isolated an individual is to target them for interventions. Still, it could also be abused by insurance companies to charge these individuals a higher rate (loneliness increases your risk of death).
Lastly, consider ways to involve the communities with stake in your SNA using approaches like community-based participatory research. Bring in representatives from target populations to help co-design your initiative or innovation as partners, rather than patients or research subjects.
Preparing Data for Analysis
Data needs to be formatted correctly for analysis, often as adjacency matrices or edgelists. Depending on the size and complexity of your network, this can be a complex process but is crucial for meaningful analysis.
If you are new to SNA, you can start by laying out your data in tables. For example, the table below shows a relational data set for a set of partners within a public health coalition. The first column shows the survey respondent (Partner 1), the second shows who they reported as a partner, the third shows their reported level of trust, and the fourth their reported level of collaboration intensity. This is just one of many ways to lay out and organize network data.
Depending on which analysis tool you choose, a varying degree of data preparation and cleaning will be required. Usually, free tools require the most work, while software with subscriptions do a lot of it for you.
| Partner 1 | Partner 2 | Trust (1-4) | Level of Collaboration |
|---|---|---|---|
| Mayor’s Office | Local Hospital | 3 | Coordination |
| Public Health Dept. | Primary Care Clinic | 4 | Cooperation |
| Mayor’s Office | Public Health Dept. | 2 | Awareness |
Network Analysis Methods & Techniques
There are many ways to analyze a network or set of entities using SNA. Here are some of basic and advanced techniques, along with info on network visualization – a major component and common output of SNA projects.
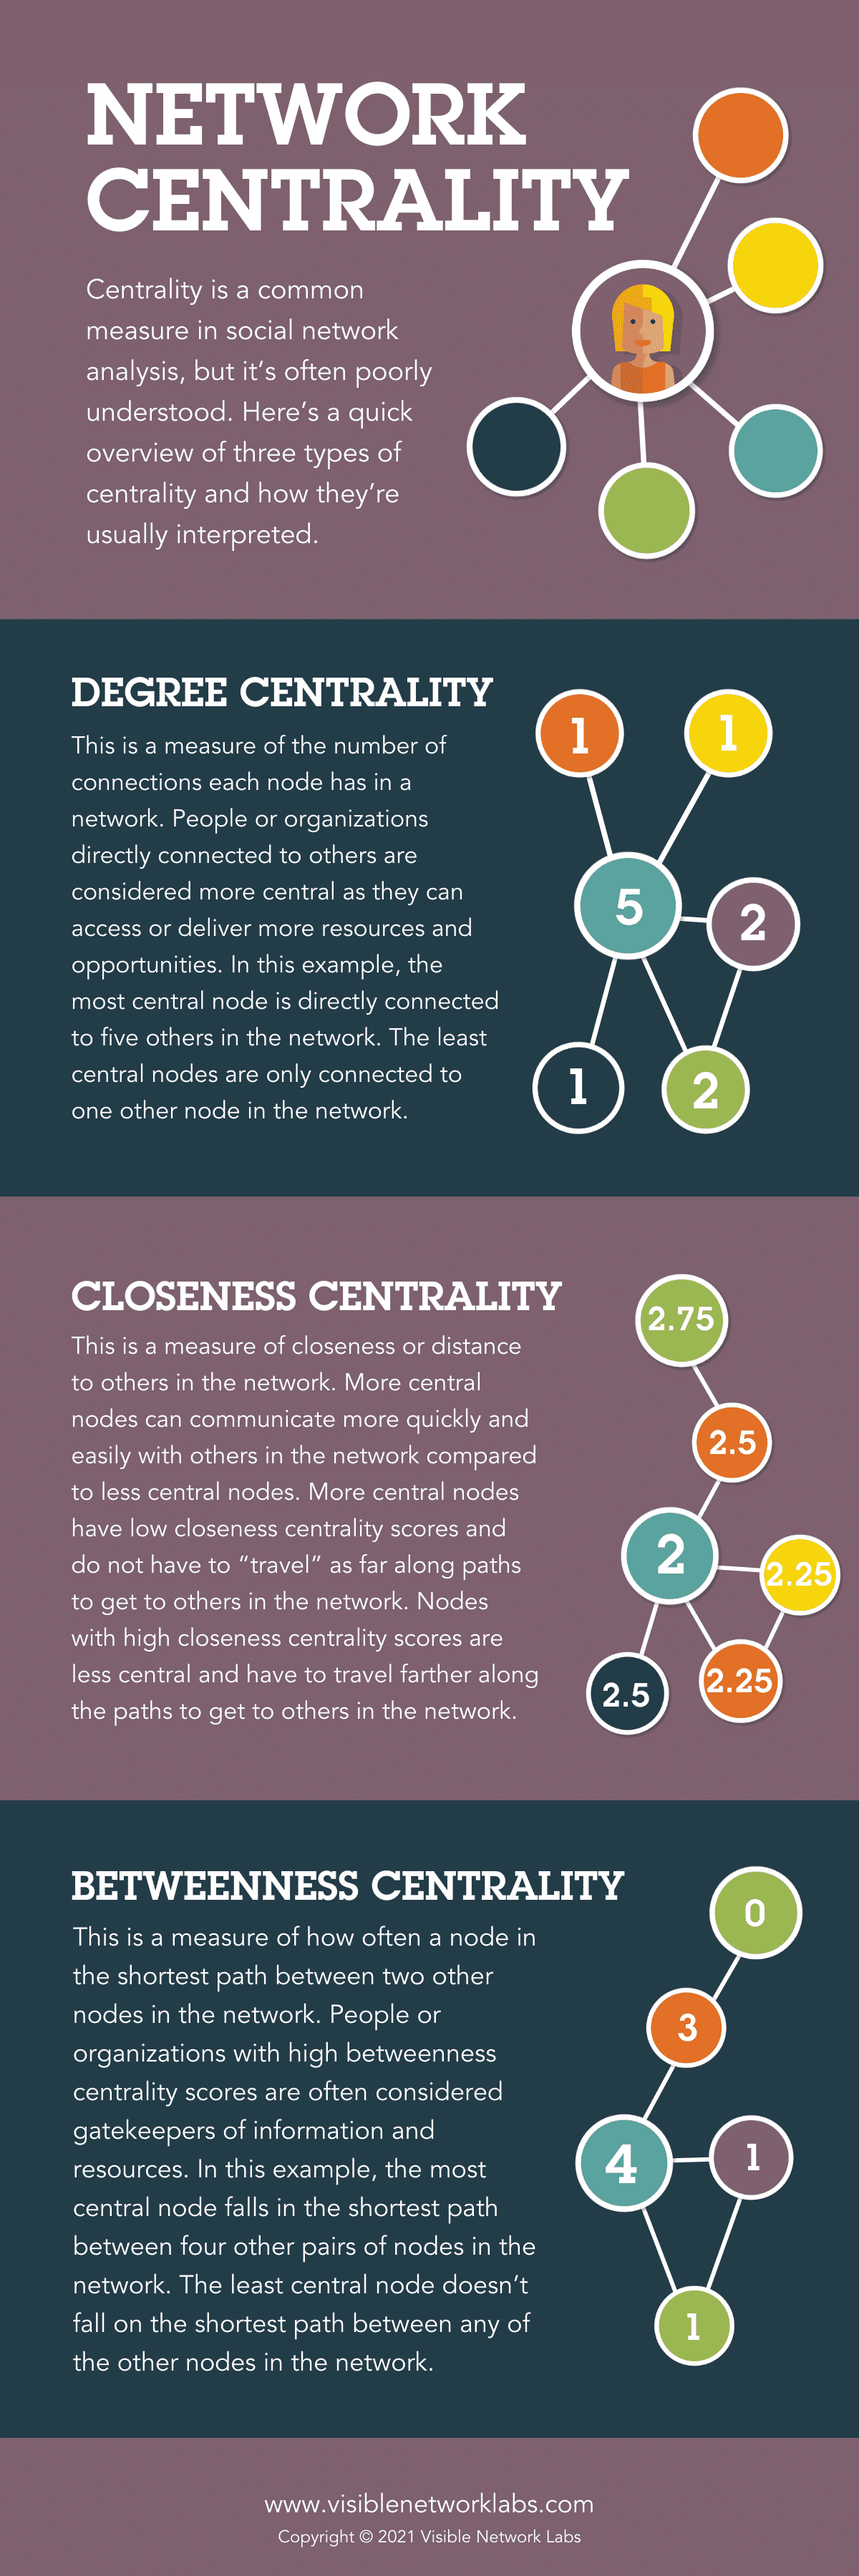
Basic Technique: Network Centrality
One of the most common ways to analyze a network is to look at the centrality of various nodes to identify key players, information hubs, and gatekeepers across the network. There are three types of centrality, each corresponding to a different aspect of connectivity and centrality. Degree, Betweenness, and Closeness Centrality are measures of a node’s importance.
Degree Centrality
Can be used to identify the most connected actors in the network. These actors are considered “popular” or “active” and they often have a strong influence within the network due to their numerous direct connections. In a coalition or network, these nodes could be the organizations or individuals that are most active in participating or the most engaged in the network activities. They may be the ‘go-to’ people for information or resources and have a significant impact on shaping the group’s agenda.
Betweenness Centrality
A useful for identifying the “brokers” or “gatekeepers” in the network. These actors have a unique position where they connect different parts of the network, facilitating or controlling the flow of information between others. In a coalition context, these could be the organizations or individuals who have influence over how information, resources, or support flow within the network, by virtue of their position between other key actors. These actors could play crucial roles in collaboration, negotiation, and conflict resolution within the network.
Closeness Centrality
A measure of how quickly a node can reach every other node in the network via the shortest paths. In a coalition, these nodes can disseminate information or exert influence quickly due to their close proximity to all other nodes. These ‘efficient connectors’ are beneficial for the rapid spread of information, resources, or innovations across the network. They could play a vital role during times of rapid change or when swift collective action is required.
Advanced Techniques: Clusters and Equivalence
Clustering Coefficients
The Clustering Coefficient provides insights into the “cliquishness” or local cohesion of the network around specific nodes. In a coalition or inter-organizational network, a high clustering coefficient may indicate that a node’s connections are also directly connected to each other, forming tight-knit groups or sub-communities within the larger network. These groups often share common interests or objectives, and they might collaborate or share resources more intensively. Understanding these clusters can be crucial for coalition management as it can highlight potential subgroups that may need to be engaged differently, or that might possess different levels of influence or commitment to the coalition’s overarching goals.
Structural Equivalence
Structural Equivalence is used to identify nodes that have similar patterns of connections, even if they do not share a direct link. In a coalition context, structurally equivalent organizations or individuals often occupy similar roles or positions within the network, and thus may have similar interests, influence, or responsibilities. They may be competing or collaborating entities within the same sectors or areas of work. Understanding structural equivalence can provide insights into the dynamics of the network, such as potential redundancies, competition, or opportunities for collaboration. It can also reveal how changes in one part of the network may impact other, structurally equivalent parts of the network.
Visualizing Networks
Network visualization is a key tool in Social Network Analysis (SNA) that allows researchers and stakeholders to see the ‘big picture’ of the network structure, as well as discern patterns and details that may not be immediately evident from numerical data. Here are some key aspects and benefits of network visualization in the context of a coalition or inter-organizational network:
Overview of Network Structure: Visualizations provide a snapshot of the entire network structure, including nodes (individuals or organizations) and edges (relationships or interactions). This helps to comprehend the overall size, density, and complexity of the network. Seeing these relationships mapped out can often make the network’s structure more tangible and easier to understand.
Identification of Key Actors: Centrality measures can be represented visually, making it easier to identify key actors or organizations within the network. High degree nodes, gatekeepers, and efficient connectors will stand out visually, which can assist in identifying who holds influence or power within the network.
Detecting Subgroups and Communities: Visualization can also highlight clusters or subgroups within the network. These might be based on shared interests, common goals, or frequent interaction. Understanding these subgroups is crucial for coalition management and strategic planning, as different groups might have unique needs, concerns, or levels of engagement.
Identifying Outliers and Peripheral Nodes: Network visualizations can also help in identifying outliers or peripheral nodes – those who are less engaged or connected within the network. These actors might represent opportunities for further engagement or potential risks for network cohesion.
Highlighting Network Dynamics: Visualizations can be used to show changes in the network over time, such as the formation or dissolution of ties, the entry or exit of nodes, or changes in nodes’ centrality. These dynamics can provide valuable insights into the evolution of the coalition or network and the impact of various interventions or events.
Software and Tools for SNA
SNA software helps you collect, clean, analyze, and visualize network data to simplify the process of of analyzing social networks. Some tools are free with limited functionality and support, while others require a subscription but are easier to use and come with support. Here are some popular s tools used across many application
Introduction to Popular SNA Tools
Tools like UCINet, Gephi, and Pajek are popular for SNA. They offer a variety of functions for analyzing and visualizing networks, accommodating users of varying skill levels. Here are ten tools for use in different contexts and applications.
- UCINet: A comprehensive software package for the analysis of social network data as well as other 1-mode and 2-mode data.
- NetDraw: A tool usually used in tandem with UCINet to visualize networks.
- Gephi: An open-source network analysis and visualization software package written in Java.
- NodeXL: A free and open-source network analysis and visualization software package for Microsoft Excel.
- Kumu: A powerful visualization platform for mapping systems and better understanding relationships.
- Pajek: Software for analysis and visualization of large networks, it’s particularly good for handling large network datasets.
- SocNetV (Social Networks Visualizer): A user-friendly, free and open-source tool.
- Cytoscape: A bioinformatics software platform for visualizing molecular interaction networks.
- Graph-tool: An efficient Python module for manipulation and statistical analysis of graphs.
- Polinode: Tools for network analysis, both for analyzing your own network data and for collecting new network data.
Choosing the Right Tool for Your Analysis:
The right tool depends on your needs. For beginners, a user-friendly interface might be a priority, while experienced analysts may prefer more advanced functions. The size and complexity of your network, as well as your budget, are also important considerations.
PARTNER CPRM: A Community Partner Relationship Management System for Network Mapping
 The problem with most social network analysis tools is the lack of specialization. They require a lot of customization and integration to complete specialized tasks and analyses – the kind that provides the most useful insight and value. A host of new SNA tools and software are developing that incorporate relationship mapping into their operation for a specific niche or need, reducing the time spent cleaning data and greatly increasing its value.
For example, we created PARTNER CPRM, a Community Partner Relationship Management System, to replace the CRMs used by most organizations to manage their relationships with their network of strategic partners. Incorporating data collecting, analysis, and visualization features alongside CRM tools like contact management and email tracking, the result is a powerful and easy-to-use network mapping tool.
SNA Case Studies
Looking for a real-world example of a social network analysis project? Here are three examples from recent projects here at Visible Network Labs.
Case Study 1: Leveraging SNA for Program Evaluation
SNA is increasingly becoming a vital tool for program evaluation across various sectors including public health, psychology, early childhood, education, and philanthropy. Its potency is particularly pronounced in initiatives centered around network-building.
Take for instance the Networks for School Improvement Portfolio by the Gates Foundation. The Foundation employed PARTNER, an SNA tool, to assess the growth and development of their educator communities over time. The SNA revealed robust networks that offer valuable benefits to members by fostering information exchange and relationship development. By repeating the SNA process at different stages, they could verify their ongoing success and evaluate the effectiveness of their actions and adjustments.
Case Study 2: Empowering Coalition-building
In the realm of policy change, building a coalition of partners who share a common goal can be pivotal in overturning the status quo. SNA serves as a strategic tool for developing a coalition structure and optimizing pre-existing relationships among the members.
The Fix CRUS Coalition in Colorado, formulated in response to the closure of five major peaks to public access, is a prime example of this. With the aim of strengthening state liability protections for landowners, the coalition employed PARTNER to evaluate their network and identify key players. Their future plans involve mapping connections to important legislators as their bill progresses through the state legislature. Additionally, their network maps and reports will prove instrumental in acquiring grants and funding.
Case Study 3: Boosting Employee Engagement
In the private sector, businesses are increasingly harnessing SNA to optimize their employee networks, both formal and informal, with the goal of enhancing engagement, productivity, and morale.
Consider the case of Acuity Insurance. In response to a transition to a Hybrid-model amid the COVID-19 pandemic, the company started using PARTNER to gather network data from their employees. Their aim was to maintain their organizational culture and keep employee engagement intact despite the model change. Their ongoing SNA will reveal the level of connectedness within their team, identify employees who are over-networked (and hence at risk of burnout), and pinpoint those who are under-networked and could be missing crucial information or opportunities.
Challenges and Future Directions in Network Analysis
Like all fields and practices, social network analysis faces certain limitations. Practitioners are constantly innovating to find better ways to conduct projects. Here are some barriers in the field and current trends and predictions about the future of SNA.
The Limitations of SNA
SNA is a powerful tool, but it’s not without limitations. It can be time-consuming and complex, particularly with larger networks. Response rates are important to ensure accuracy, which makes data collection more difficult and time-consuming. SNA also requires quality, validated data, and the interpretation of results can be subjective. Software that helps to address these problems requires a significant investment, but the results are often worth it.
Lastly, SNA is a skill that takes time and effort to learn. If you do not have someone in-house with network analysis skills, you may need to hire someone to carry out the analysis or spend time training an employee to build the capacity internally.
Current Trends and Future Predictions
One emerging trend is the increased application of SNA in mapping inter-organizational networks such as strategic partnerships, community health ecosystems, or policy change coalitions. Organizations are realizing the power of these networks and using SNA to navigate them more strategically. With SNA, they can identify key players, assess the strength of relationships, and strategize on how to optimize their network for maximum benefit.
In line with the rise of data science, another trend is the integration of advanced analytics and machine learning with SNA. This fusion allows for the prediction of network behaviors, identification of influential nodes, and discovery of previously unnoticed patterns, significantly boosting the value derived from network data.
The future of SNA is likely to see a greater emphasis on dynamic networks – those that change and evolve over time. With increasingly sophisticated tools and methods, analysts will be better equipped to track network changes and adapt strategies accordingly.
In addition, there is a growing focus on inter-organizational network resilience. As global challenges such as pandemics and climate change underscore the need for collaborative solutions, understanding how these networks can withstand shocks and adapt becomes crucial. SNA will play an instrumental role in identifying weak spots and strengthening the resilience of these networks.
Conclusion: Social Network Analysis 101
SNA offers a unique way to visualize and analyze relationships within a network, be it within an organization or between organizations. It provides valuable insights that can enhance communication, improve efficiency, and inform strategic decisions.
This guide provides an overview of SNA, but there is much more to learn. Whether you’re interested in the theoretical underpinnings, advanced techniques, or the latest developments, we encourage you to delve deeper into this fascinating field.
Resources and Further Reading
For those who want to build more SNA skills and learn more about network science, check out these recommendations for further reading and exploration from the Visible Network Labs team of network science experts.
Recommended Books on SNA
- “Network Science” by Albert-László Barabási – A comprehensive introduction to the theory and applications of network science from a leading expert in the field.
- “Analyzing Social Networks” by Steve Borgatti, Martin Everett, and Jeffrey Johnson – An accessible introduction, complete with software instructions for carrying out analyses.
- “Social Network Analysis: Methods and Applications” by Stanley Wasserman and Katherine Faust – A more advanced, methodological book for those interested in a deep dive into the methods of SNA.
- “Connected: The Surprising Power of Our Social Networks and How They Shape Our Lives” by Nicholas Christakis and James Fowler – An engaging exploration of how social networks influence everything from our health to our political views.
- “The Network Imperative: How to Survive and Grow in the Age of Digital Business Models” by Barry Libert, Megan Beck, and Jerry Wind – An excellent book for those interested in applying network science in a business context.
- “Networks, Crowds, and Markets: Reasoning About a Highly Connected World” by David Easley and Jon Kleinberg – An interdisciplinary approach to understanding networks in social and economic systems. This book combines graph theory, game theory, and market models.
Online Resources and Courses
Here are some online learning opportunities, including online courses, communities, resources hubs, and other places to learn about social network analysis.
- Coursera: There are several courses on social network analysis offered by Coursera, including:
- Social Network Analysis by Lada Adamic from the University of Michigan
- Social and Economic Networks: Models and Analysis by Matthew O. Jackson from Stanford University
- Introduction to Social Network Analysis by Dr. Jennifer Golbeck from the University of Maryland, College Park
- Statistics.com: Statistics.com offers a free online course called Introduction to SNA taught by Dr. Jennifer Golbeck.
- The Social Network Analysis Network: This website provides a directory of resources on network methods, including courses, books, articles, and software.
- The SNA Society: This organization provides a forum for social network analysts to share ideas and collaborate on research. They also offer a number of resources on their website, including a list of online courses.
Journals and Research Papers on SNA
These are a few of the most influential cornerstone research papers in network science and analysis methods:
- “The Strength of Weak Ties” by Mark Granovetter (1973)
- “Structural Holes and Good Ideas” by Ronald Burt (2004)
- “Collective dynamics of ‘small-world’ networks” by Duncan Watts & Steven Strogatz (1998)
- “The structure and function of complex networks.” by M.E. Newman (2003).
- “Emergence of scaling in random networks” by A. Barabasi (1999).
Check out these peer-reviewed journals for lots of network science content and information:
- Social Networks: This is an interdisciplinary and international quarterly journal dedicated to the development and application of network analysis.
- Network Science: A cross-disciplinary journal providing a unified platform for both theorists and practitioners working on network-centric problems.
- Journal of Social Structure (JoSS): An electronic journal dedicated to the publication of network analysis research and theory.
- Connections: Published by the International Network for Social Network Analysis (INSNA), this journal covers a wide range of social network topics.
- Journal of Complex Networks: This journal covers theoretical and computational aspects of complex networks across diverse fields, including sociology.
Frequently Asked Questions about SNA
A: SNA is a research method used to visualize and analyze relationships and connections within a network. In an organizational context, SNA can be used to explore the structure and dynamics of an organization, such as the informal connections that drive formal processes. It can reveal patterns of communication, identify influential entities, and detect potential bottlenecks or gaps.
A: The primary purpose of SNA is to uncover and visualize the relationships between entities within a network. By doing so, it allows us to understand the network’s structure and dynamics. This insight can inform strategic decision-making, facilitate change management, and enhance overall efficiency within an organization.
A: SNA allows researchers to examine the relationships between entities, the overall structure of the network, and the roles and importance of individual entities within it. This can involve studying patterns of communication, collaboration, competition, or any other type of relationship that exists within the network.
A: SNA has a wide range of applications across various fields. In business, it’s used to analyze organizational structures, supply chains, and market dynamics. In public health, it can map the spread of diseases. In sociology and anthropology, SNA is used to study social structures and relationships. Online, SNA is used to study social media dynamics and digital marketing strategies.
A: Key concepts in SNA include nodes (entities) and edges (relationships), network properties like density and centrality, and theories such as the Strength of Weak Ties and Structural Hole Theory. It also encompasses concepts like homophily and heterophily, which describe the tendency for similar or dissimilar nodes to connect.
A: An example of SNA could be a study of communication within a corporation. By treating departments as nodes and communication channels as edges, analysts could visualize the communication network, identify key players, detect potential bottlenecks, and suggest improvements.
A: Social Network Analysis refers to the method of studying the relationships and interactions between entities within a network. It involves mapping out these relationships and applying various analytical techniques to understand the structure, dynamics, and implications of the network.
A: In psychology, SNA can be used to study the social relationships between individuals or groups. It might be used to understand the spread of information, the formation of social groups, the dynamics of social influence, or the impact of social networks on individual behavior and well-being.
A: SNA can be conducted at different levels, depending on the focus of the study. The individual level focuses on a single node and its direct connections (ego networks). The dyadic level looks at the relationship between pairs of nodes, while the triadic level involves three nodes. The global level (whole network) considers the entire network.
A: There are several types of networks in SNA, including ego networks (focused on a single node), dyadic and triadic networks (focused on pairs or trios of nodes), and whole networks. Networks can also be categorized by their structure (like centralized or decentralized), by the type of relationships they represent, or by their application domain (such as organizational, social, or online networks).
A: SNA is used to visualize and analyze the relationships within a network. Its insights can inform strategic decisions, identify influential entities, detect potential weaknesses or vulnerabilities, and enhance the efficiency of communication or processes within an organization or system. It’s also an essential tool for research in fields like sociology, anthropology, business, public health, and digital marketing.
Connect with our Team!
Contact the VNL team to demo PARTNER™ or discuss a research or evaluation project. We can help you learn more about our services, help brainstorm project designs, and provide a custom scope based on your budget and needs. We look forward to connecting!
Email our team: hello@visiblenetworklabs.com
Send a message: Contact Us Here