Navigating the complexities of Social Network Analysis (SNA) can feel like deciphering an intricate map without a compass or key. Whether you’re a beginner stepping into the realm of network science, a seasoned analyst brushing up your knowledge, or a business leader aiming to harness the power of SNA for strategic decision-making, understanding the jargon is the first step.
In this blog post, we’ll walk you through the fundamental terminologies, from Nodes and Edges to Betweenness Centrality and Degree Distribution, providing a clear definition and detailed explanation. Our goal is to demystify the language of SNA and equip you with the knowledge needed to successfully navigate and leverage network analysis in your projects. So, let’s dive into the exciting world of SNA, one key term at a time!
Table of Contents
Background: What is Social Network Analysis?

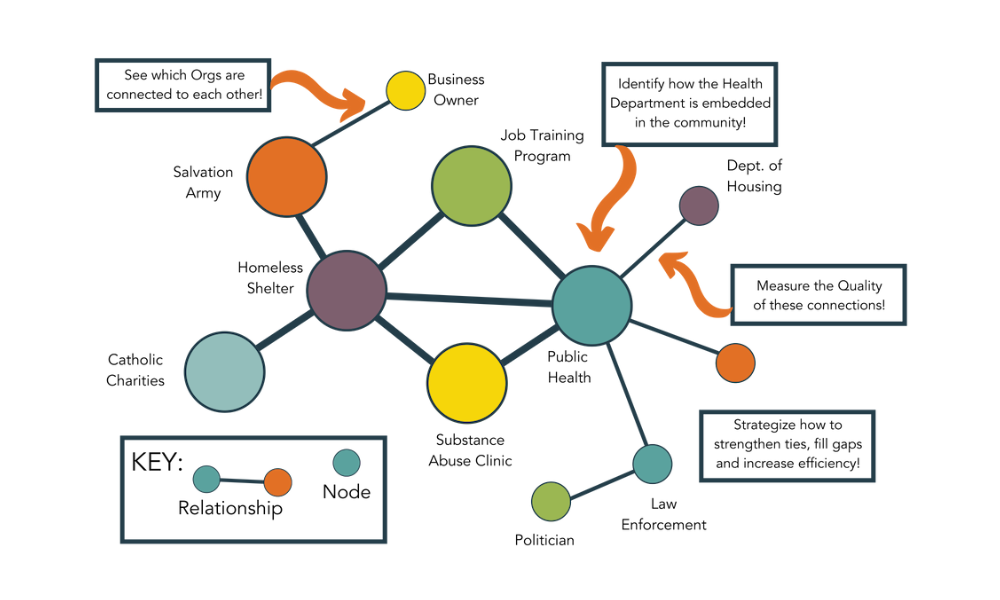
This approach interprets social relationships through network theory’s lens, considering individuals or organizations as nodes and their relationships as ties. It’s the focus on the structure of these relationships and their consequent patterns that illuminate the dynamics and influential roles within the group, providing both a visual and mathematical representation of social relationships, hence revealing insights that would otherwise remain invisible. Read our complete Social Network Analysis 101 Guide to learn more.
The Benefits of SNA for Organizations
SNA proves particularly valuable in inter or intra-organizational environments for several reasons:
- Identifying Key Players: Through measures like degree centrality or betweenness centrality, SNA helps identify who are the most connected or influential entities in the network, crucial for information dissemination or change management initiatives.
- Improving Communication: By visualizing the communication pathways, SNA can help identify communication bottlenecks or isolated entities, which can then be addressed to improve information flow and collaboration.
- Understanding Group Dynamics: SNA can shed light on the various cliques or clusters within a network, revealing subgroups and alliances that might be invisible otherwise. This can help in managing team dynamics or in understanding the power dynamics within the network.
- Mapping Knowledge Transfer: In an organizational context, SNA can help identify who the knowledge holders are and how knowledge spreads within the network. This can inform strategies for knowledge management and innovation.
By providing a bird’s eye view of the complex network structure and giving quantifiable measures to otherwise qualitative social relations, Social Network Analysis can serve as a powerful tool in an organizational context to inform strategy, enhance cooperation, and improve efficiency.

Get our monthly newsletter with resources for cross-sector collaboration, VNL recommended reading, and upcoming opportunities for engaged in the “network way of working.”
SNA Key Terms and Definitions
These 30 terms form the foundation for most network analysis projects. Learning them is a great way to demystify this methodology and understand how it works and the insights it provides.
1. Nodes (or Vertices)
These are the individual entities within the network, which could be people, groups, or other organizations. They are the basic unit of analysis in a social network. For example, in a friendship network, each person would be a node.
2. Edges (or Links or Ties)
These represent relationships or interactions between nodes. For instance, an edge may represent a friendship between two people or a business transaction between two companies.
3. Degree
This is the number of connections a node has. A person with a high degree in a social network could be considered popular or influential as they have many connections to others.
4. Density
A measure of how many connections exist in the network compared to how many could possibly exist. High density networks suggest that many members are connected to each other, promoting quick information or disease spread.
5. Degree Centrality
This quantifies the importance of a node within the network. Nodes with high centrality are influential within the network due to their connections.
6. Betweenness Centrality
This is a type of centrality that quantifies the number of times a node acts as a bridge along the shortest path between two other nodes. It identifies nodes that connect different parts of a network.
7. Closeness Centrality
Another type of centrality that measures how close a node is to all other nodes in the network. Nodes with high closeness centrality can quickly interact with all others.
8. Eigenvector Centrality
This form of centrality considers the influence of a node’s neighbors. Nodes are important if they are connected to other important nodes.
9. Clusters (or Communities)
These are groups of nodes that have a higher density of ties among themselves than with nodes outside the group. For instance, groups of friends within a larger social network.
10. Subgraph
A subset of the nodes and the edges from the larger network. For instance, the network of one’s close friends within one’s overall social network.
11. Graph
A mathematical structure that captures the relationship between entities. In social network analysis, the graph represents the social network.
12. Degree Distribution
The probability distribution of degrees over the entire network. It’s often used in network analysis to identify the type of network (e.g., random, scale-free).
13. Modularity
A measure that quantifies the strength of division of a network into modules (also called groups, clusters or communities). Networks with high modularity have dense connections between nodes within modules but sparse connections between nodes in different modules.
14. Homophily
The tendency of individuals to associate and bond with similar others. In social networks, it can be seen as a clustering of similar nodes.
15. Heterophily
The tendency of individuals to bond with dissimilar others. It is the opposite of homophily and can enhance diversity within a network.
16. Isolates
These are nodes with no ties or connections to others. In social network analysis, isolates can be seen as outcasts or unique entities.
17. Multiplexity
This refers to the number of different types of relationships between nodes. For example, two people could be friends, work colleagues, and neighbors, resulting in a multiplex relationship.
18. Reciprocity
The extent to which pairs of nodes exchange resources or support. A high degree of reciprocity often indicates a stable relationship.
19. Structural Hole
A gap in a network where a node is connected to diverse clusters that are not connected to each other. The node in the middle can control information flow between the clusters.

Get our monthly newsletter with resources for cross-sector collaboration, VNL recommended reading, and upcoming opportunities for engaged in the “network way of working.”
20. Path Length
The distance between two nodes, calculated by the number of edges along the shortest path connecting them. It’s a crucial concept in understanding network navigation and information flow.
21. Dyad
A pair of nodes and the relationship between them. It’s the simplest possible social group in network analysis.
22. Triad
A group of three nodes and the relationships between them. Triads are essential to understanding more complex relational dynamics.
23. Ego Network
A specific type of subgraph focused on one node (the ego) and its direct connections (the alters). Ego networks provide a micro view of a larger network.
24. Adjacency Matrix
A mathematical representation of a network where rows and columns correspond to nodes and cell entries indicate whether an edge exists between them. It’s a common format for computer processing of networks.
25. Attribute
A property or characteristic of a node or an edge. Attributes can provide additional information about entities in a network (e.g., gender, age, location of individuals).
26. Affiliation Network
A type of network where there are two types of nodes and edges are only allowed between unlike nodes. For example, a network of people and the events they attend.
27. Cohesion
The degree to which nodes are directly connected to each other. High cohesion often indicates a high degree of group solidarity or unity.
28. Cut-point
A node that, if removed, would disconnect the network. Cut-points are crucial for understanding network resilience and vulnerability.
29. Social Capital
The resources and benefits that individuals can access through their social networks. It’s a broad concept capturing the value derived from social relationships.
30. Network Dynamics
The study of how network structure and composition change over time. This can include the addition or removal of nodes and edges, changes in network attributes, or shifts in the overall network layout.

Getting Started with SNA using PARTNER CPRM
Having explored key Social Network Analysis (SNA) terms, let’s introduce a tool that utilizes these concepts to boost community collaboration in public health: PARTNER CPRM software. Built on robust network science and SNA principles, PARTNER CPRM facilitates strategic network building and nurturing to meet shared objectives. With our tool, visualize, map, and track your community partner network, break down partnership silos, improve communication, and save crucial resources.
In addition to the software, our team offers a range of supportive services, including advanced analytics and reporting, personalized training, and capacity building. This holistic approach not only equips you with a powerful tool but also revolutionizes how your organization collaborates to enhance community health outcomes.
Learn More: Request a Demo!
Ready to transform your network management with the power of SNA? Request a personalized demo of PARTNER CPRM today. Experience firsthand how our software can optimize your approach to community partnerships and health equity initiatives.
Our experts will guide you through its tailored features, ensuring you harness the full potential of your collaborative network. Your journey towards a more strategic, connected community network starts here.
Social Network Analysis Key Terms: The Last Word
Social network analysis is a powerful methodology, but there is a steep learning curve for those new to it. Learning these 30 social network analysis key terms is a great way to build the foundational knowledge required to apply more advanced analytical methods and techniques. PARTNER CPRM is our SNA platform for mapping and tracking your community partnership ecosystem. Learn more on our CPRM Guide or contact our team to arrange a Discovery Call with a network scientists. We can’t wait to connect!
Frequently Asked Questions
Here are some additional questions related to these social network analysis key terms and definitions. If you have a question we haven’t addressed, leave a comment below, and we will get back to you with an answer as soon as we can.
A: Key terms associated with social network analysis include nodes (individuals or entities within the network), edges (the relationships or interactions between nodes), degree centrality (the number of direct connections a node has), betweenness centrality (a measure of a node’s centrality in a network), clusters (groups of nodes with a high density of ties), and many others.
A: The main components in social network analysis are nodes and edges. Nodes represent actors or entities in the network, such as individuals, organizations, or countries. Edges represent the relationships or interactions between these entities, like communication, transactions, or collaborations.
A: The basic steps of social network analysis include defining the research question, determining the set of nodes (boundary specification), identifying and documenting relationships (edges), data collection, network visualization, calculation of network measures, and finally, interpretation of the results in line with the original research question.
A: Key components of a network include nodes (the individual actors within the network), edges (the relationships between the actors), the adjacency matrix (a square matrix used to represent a finite graph), attributes of nodes and edges (like name, weight, color, etc.), and potentially subgroups or clusters within the network.
A: The four dimensions of social network analysis typically include structural (examining the overall network configuration), relational (studying the relationships between nodes), multiplexity (looking at multiple types of relationships), and dynamic (analyzing changes in the network over time).
A: Metrics in social network analysis are quantitative measures used to analyze and compare networks. These can include measures of centrality (like degree, betweenness, closeness, and eigenvector centrality), density (proportion of possible edges that exist), diameter (the longest shortest path between any two nodes), and modularity (a measure of the structure of network clusters or communities), among others.
A: The three levels of analysis in social network analysis are the micro-level (focusing on individuals within the network), the meso-level (focusing on subgroups or clusters within the network), and the macro-level (focusing on the network as a whole).


