How to Analyze a Network Map: An Infographic
If you’ve ever looked at a map of a social network, it probably looked like a jumble of interconnected lines and nodes. Without the right skill and training, analyzing such a network map is an incredibly difficult task. You need to have an understanding of social network analysis terminology and methods, as well as an account of the network’s unique context and history.
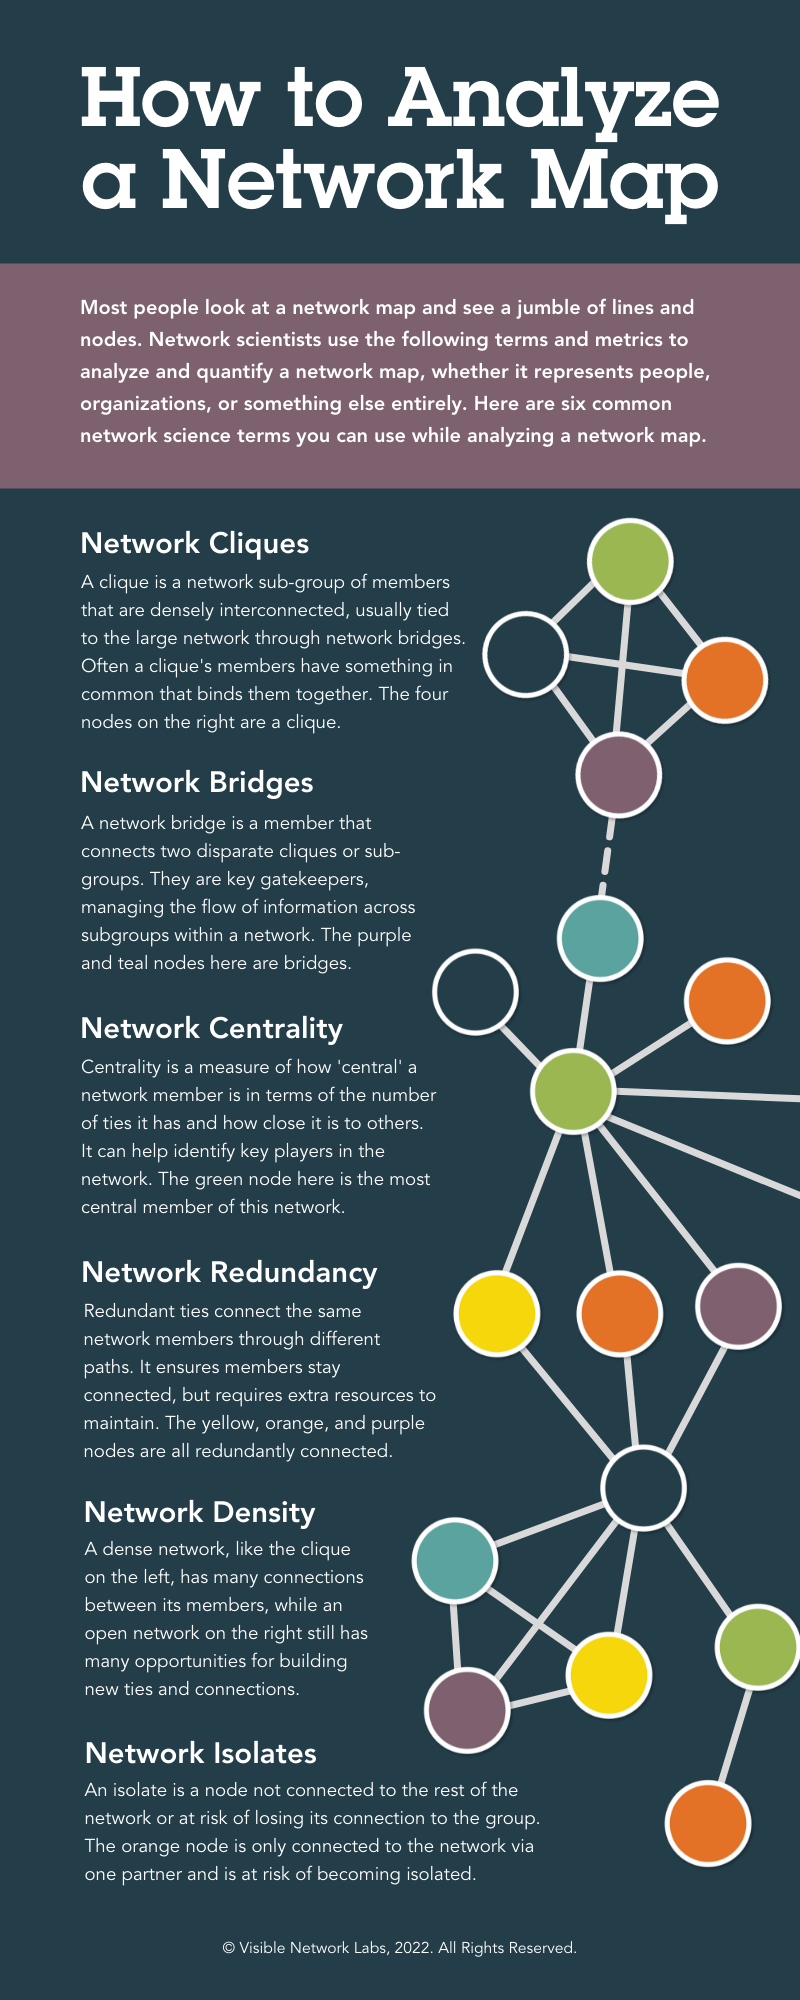
While we cannot get you up to speed about the specifics of your network, we can help with the network science part of the problem! In this new VNL infographic, we put together six common areas we look at when analyzing a new network map. Each dimension leads to unique types of insight that can be used to strengthen and improve the network over time.
We hope this infographic will help you better understand how to analyze a network map. If you want to learn more, contact our team to arrange a time to talk and connect.

If you want to begin collecting network data so you can draw and analyze your own network maps, you should consider using the PARTNER CPRM. This powerful platform has tools for collecting, mapping, and analyzing networks, along with an Insights Library to translate your results into action. Click here to learn more about the PARTNER Community Partner Relationship Manager
Want to learn more about how to analyze a network map? Visit our Network Leadership Resource Library to see blogs, webinars, and other infographics on this very important network leadership topic. You can also share a comment below with the VNL community to add your thoughts on the subject. We hope you found our infographic helpful and informative!


