PARTNER CPRM Interactive Simulation:
Snow White and Her Support Network
This interactive demo is designed for those new to network science and social network analysis. Using the example of Snow White and her support network from the popular Disney movie, you’ll learn how PARTNER CPRM maps and analyzes relationships to generate powerful, actionable insights. Login to your free trial account to get started, then scroll through the simulation instructions below.
Table of Contents
Request a PARTNER Demo
Talk to a network expert and learn how PARTNER CPRM can change how you build networks.
Introduction
 Snow White is a well-known fairy tale, popularized by the 1937 animated movie created by Disney. In the story, based on an 1812 original, a beautiful young princess lives with her wicked Stepmother, the Queen. Jealous of her beauty, the Queen tries to have Snow White killed, but she flees into the woods and stumbles upon a small cottage, the home of seven miners: Doc, Grumpy, Happy, Sleepy, Bashful, Sneezy, and Dopey.
Inviting her to stay with them, they work with the animals of the forest and Prince Charming to keep Snow White safe. Eventually, they defeated the Queen and partners and revived Snow White from a magical slumber. The story is a good example of the power of networks and relationships to achieve change and create positive, lasting impacts on our communities.
For this simulation, we’ve provided a sample relational dataset in your free trial account that represents Snow White’s relationships with the seven dwarves, the Queen, and the Huntsman. You can open up this dataset within your PARTNER CPRM account and then walk through each of the steps below to try visualizing and exploring it in different ways.
We recommend using two monitors, if possible, with this page on one and PARTNER open on the other. Alternatively, you can switch back and forth with two tabs or use two half-page screens.
If you have questions during the simulation, you can email us at hello@visiblenetworklabs.com
Demo Purpose
This simulation is designed to let you try using PARTNER CPRM and interpreting relational data using an example you’ve probably heard about before.
The simulation focuses on mapping and analyzing relational data within PARTNER. To see how you can manage network members, collect relational data, and build reports, continue on to our Community Health Coalition simulation next.
Demo Instructions
This simulation should be completed with the PARTNER CPRM platform open in a second tab or window. Each section begins with directions on where to navigate within the platform and what you should see if you are in the right place. Then, you will have a series of questions to consider about the network map or visualization on screen.
First, log in to your PARTNER CPRM account and open the Snow White Simulation from the homepage:
- Part 1: Visualize your network and analyze your size and membership.
- Part 2: Explore the inter-relationships within each network.
- Part 3: Assess perceptions of reliability across both networks.
- Part 4: Analyze the activities the network engages in together.
- Part 5: Map the exchange of information across the networks.
- Part 6: Propose a few action steps for both networks to keep improving.
Questions? Email hello@visiblenetworklabs.com
Part 1: Map the Members of Snow White's Network
To get started, log in to your PARTNER CPRM free trial account. If you haven’t created an account, you can do so here.
Once logged in, follow the directions below to navigate to the Network Analyzer and create your first map of Snow White’s support network. Then, follow along and read through our Questions to Consider for each visualization before moving on to the next step.
The first map we create is a simple visualization of Snow White’s and the Evil Queen’s networks without relationship ties. This makes it easier to assess the network members as individual entities with unique attributes. Later, we can add ties to explore the structure and quality of their relationships and interactions.
Follow the instructions below to access your sample dataset for this simulation and generate the right network map.
Directions:
- Log in to your PARTNER CPRM Account.
- Click “Account” on the bottom left.
- Under “Ecosystem Selection,” click “Snow White and Her Support Network (Read Only).”
- Click “Networks” under “Explore” on the left side of the screen.
- Then, make sure that “Snow White and Her Support Network” is selected using the dropdown selector above the node settings.
You should see this network map.
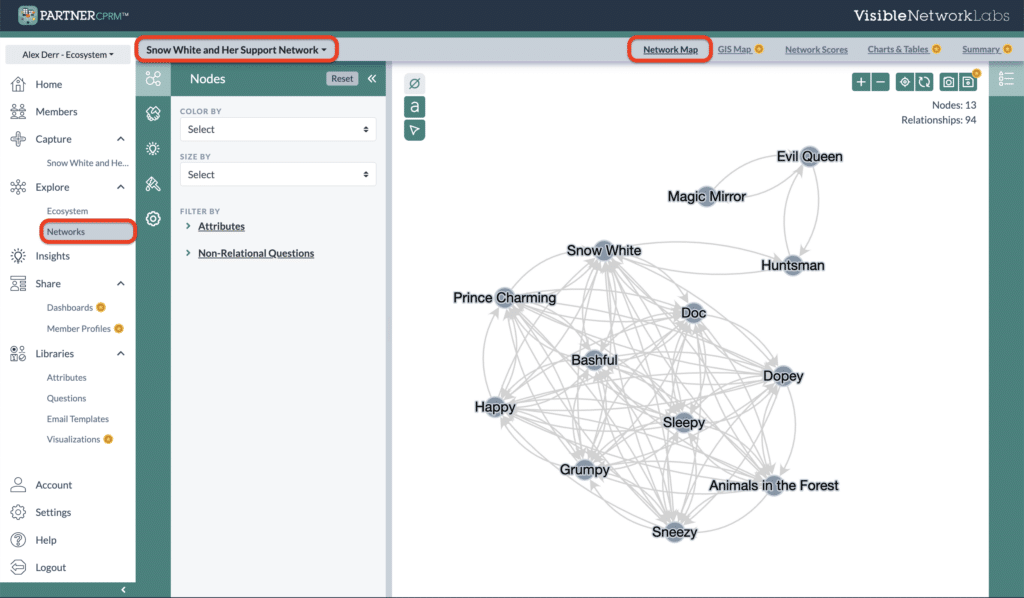
A map of Snow White’s Social Support Network. Nodes represent entities; lines show where relationships exist.
This map shows who knows who across the entire network. This can be a bit confusing at first.
In this map, each of the circles is called a ‘node,’ which represents one individual or entity within the network. In this example, each node is a member of Snow White’s support network. The lines that connect the nodes are called ‘edges’ which represent the presence of connection, relationship, or interaction between two nodes.
Before we dig into these relationships, we always start by looking at the individual network members and compare and contrast their attributes. Later, we’ll explore these relationships and interactions in more depth.
Follow the directions below to filter out a relationship attribute and view our members alone.
Directions:
- Open Relationship Settings (handshake icon).
- Click the dropdown menu below “Color By” and select the first question, “To what extent…”
- Open the Legend on the right side of the screen.
- Click each relationship option to hide those ties.
- Open Node Settings (top menu on left).
- Under “Color By” select “What is the mission…”
You should see members without any connections, colored according to their individual missions.
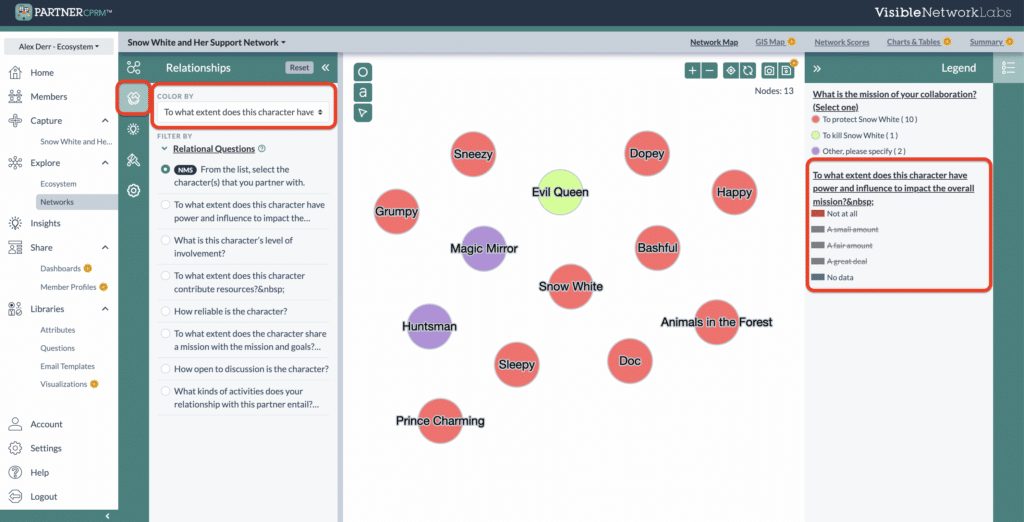
The members of Snow White’s network colored according to their individual missions.
Looking at Snow White’s support network members, we can glean several initial insights about their collaboration.
First, the network is dominated by people who aim to protect Snow White. On the contrary, only the Queen has a primary mission to kill Snow White. Two other network members, the Huntsman and the Magic Mirror, are neutral and neither aim to kill or protect Snow White.
This dramatic mission misalignment across the network gives Snow White an immediate advantage over the Queen, who is alone with her mission.
Now, let’s dig into the relationships across the network to see how they might predict how the story concludes.
Part 2: Explore the Network's Interrelationships
The relationships and interconnections between members are the foundation of any support network, whether it’s a group of people or a coalition of organizations. By visualizing these relationships and understanding their structure and quality, we can identify ways to improve them and create action steps for the future.
First, we need to view the default network map, which shows who within Snow White’s support network knows each other and the Queen. Follow the directions below within PARTNER CPRM to continue.
Directions:
- Open the Relationship Filter tab on the left side of the screen (the handshake icon).
- Click “Reset” at the top, next to “Settings.”
- Click the tab icon on the left and/or the Legend icon on the right to minimize them and make more room for analysis.
You should see a network map similar to the one on the right.
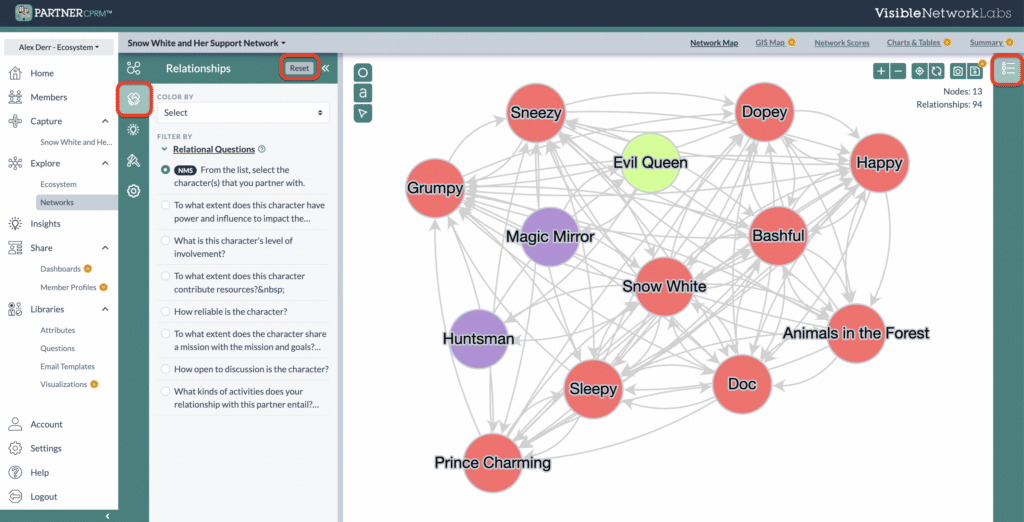
A map of Snow White’s social support network and the Queen’s. A line shows two characters have a relationship.
Note: If your map does not look like the map above, you can adjust your visual settings in the settings tab on the left (the gear icon). Use the options to change the node, label, and tie appearance. You can also click and drag a node to move them around into positions that make more sense.
Take a look at the overall network. It appears that the network of the Evil Queen and Snow White are actually interconnected, with the Huntsman serving as a bridge node between them. This provides an opportunity for information to flow from one network to the other – like when the Huntsman warns Snow White to flee to the forest and hide.
Snow White’s network, identified by their shared mission to protect her, are all densely inter-connected. Not only do her seven housemates know each other well, but they are also acquainted with the animals of the forest and Prince Charming.
Here are a few questions to consider while you analyze and interpret this network map.
Questions to Consider:
How does the Huntsman’s position as a bridge node influence the dynamics between the two networks? and
What potential advantages or vulnerabilities does this bridge present for both Snow White and the Evil Queen?
Given that the Queen’s two connections do not know each other, what implications does this have for information flow, reliability, and the Queen’s potential need for intermediation?
Part 3: Assess Perceptions of Reliability
Looking at the initial network map is just one way to explore your relationships. Now we can use a variety of metrics and additional information to peel back the layers of Snow White’s network of support and see how it differs from that of the Evil Queen.
First, we can look at how each member of the network perceives each other, which provides insight into the levels of trust and value across partners. Studies suggest that these are two critical factors that must exist for successful collaboration and partnerships.
Follow the directions below to visualize how the network members perceive each other’s reliability.
Directions:
- Open the Relationship tab on the left side of the screen (the handshake icon).
- Click the dropdown menu under “Color By” and click “How Reliable is the Character?”
- You can minimize the Relationship Filter Tab and use the Legend on the right to filter out the responses to see them individually.
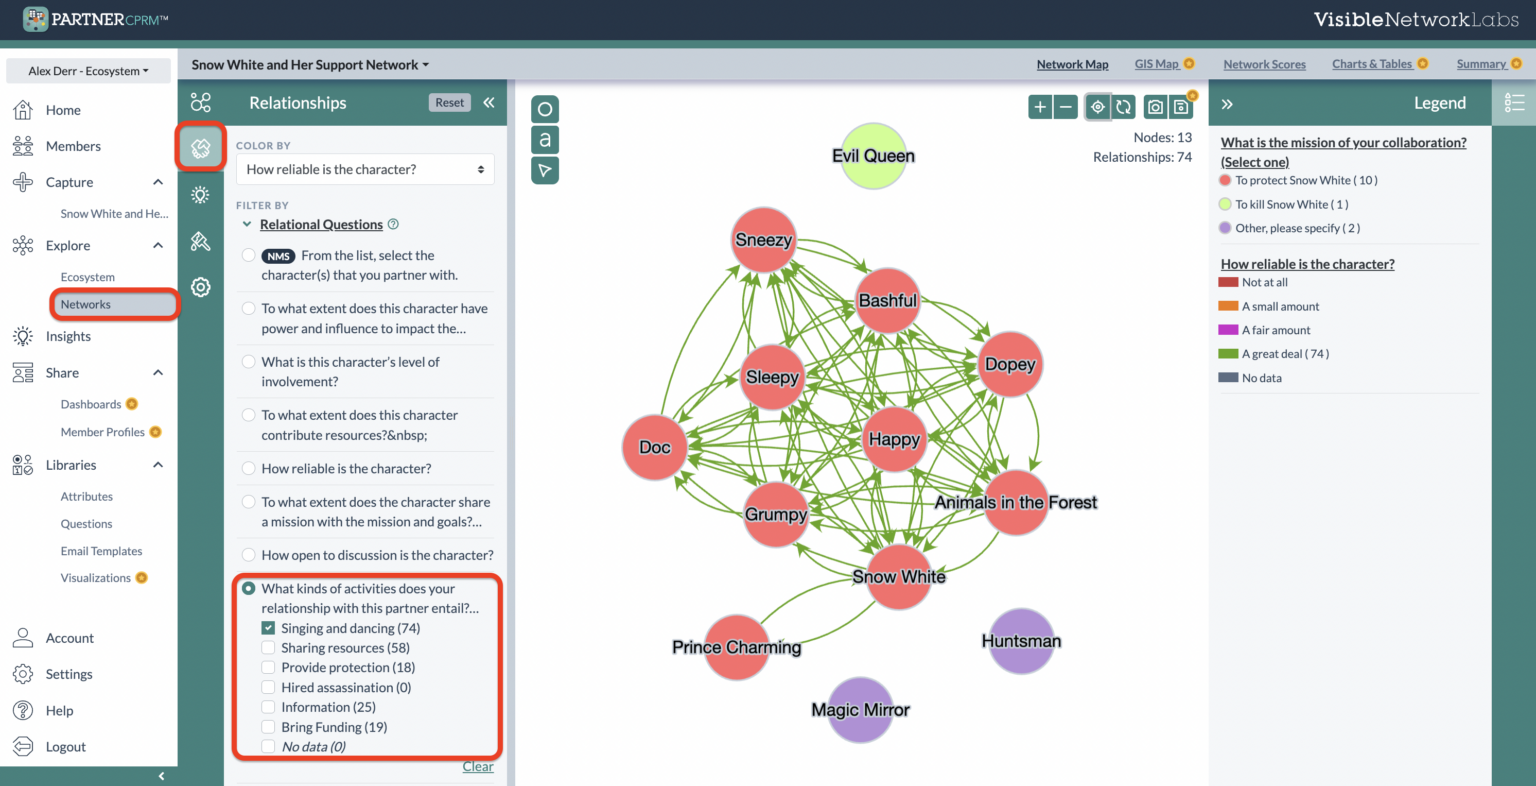
You should see a network map similar to this one.

Snow White’s social network, with lines colored according to perceptions of reliability (green=reliable; red=unreliable)
Everyone in Snow White’s support network perceives each other as very reliable, one of the three hallmarks of trust between partners in our PARTNER CPRM data framework. People who view each other as reliable are more likely to engage with them and invest their time and energy, knowing that their partner will most likely follow through when push comes to shove.
On the other hand, the Evil Queen’s network views each other in various ways. While there appears to be mistrust between the Queen and Huntsman, with both viewing the other as unreliable, the Queen continues to view the Magic Mirror as a reliable partner. Conversely, the Magic Mirror believes the Evil Queen has proven herself unreliable.
With such a lack of trust by her two primary partners, the Evil Queen must overcome their lack of engagement and failure to follow through at multiple critical points in the story. Here are some additional questions to consider as you interpret this network map of perceptions of reliability.
Questions to Consider:
How might Snow White’s consistent reliability with her network partners influence the overall success and resilience of her support system?
Considering the mistrust between the Evil Queen and Huntsman, what strategies might the Queen employ to rebuild trust, and how essential is it for her to do so?
How does the Magic Mirror’s perception of the Evil Queen’s unreliability impact their dynamic? What implications might this have on the Queen’s actions and decisions?
Part 4: Analyze Activities the Network Engages In
The members of Snow White’s support network, as well as the Queen and her partners, all take an active role in the story and work together in multiple ways.
However, as you may know from the Disney Movie, Snow White and her friends also spend time signing, dancing, and enjoying the company of friends. We can analyze the activities that a network’s members engage in better to understand the nature of their relationships and collaboration.
Follow the directions below to visualize the different activities the characters engage in together.
Directions:
- Open the Relationship Filter Tab on the left side of the screen (the handshake icon).
- Below “Filter By,” click “Relational Questions,” scroll down, and select ‘What kinds of activities…’
- Deselect all response options except “Singing and Dancing.”
You should see the network map on the right.
A map showing who engages with others in singing and dancing across the networks.
Tip: If you do not see the Evil Queen and her partners, click the Node Filter Tab (the two-node icon) and ensure the box titled “Show Isolated Nodes” is checked.
This map shows which network members sing and dance with each other. Unsurprisingly, all of Snow White and her network members reported regularly singing and dancing, while the Queen, Huntsman, and Magic Mirror all reported zero singing and dancing.
This seems trivial, but it points to the importance of building long-term, authentic relationships to generate strong, trusting relationships with your partners. The Evil Queen tends to view relationships with her partners from a purely transactional lens, and her results demonstrate the usual outcome.
Here are some additional questions to consider while interpreting this network map.
Questions to Consider:
How might engaging in communal activities like singing and dancing influence the development of trust and rapport within a network?
Considering the regular singing and dancing among Snow White’s network, what impact might this shared activity have on their team dynamics, communication, and problem-solving capabilities?
Beyond just singing and dancing, what other communal or team-building activities could be indicative of a network’s cohesion, trust, and willingness to collaborate for shared goals?
Part 5: Map the Exchange of Information
While some networks engaged in shared activities like Snow White and her friends, others focus on sharing information and resources with each other to achieve shared goals. The story of Snow White provides several examples of this in action within her support network.
Follow the directions below to visualize how her network members share information.
Directions:
- Return to the Relationship Filter Tab and scroll down to the Relational Question options.
- Find the question “What kind of activities…” which should still be selected.
- Select the response option “Information” and de-select “Singing and Dancing.”
You should see the network map on the right.
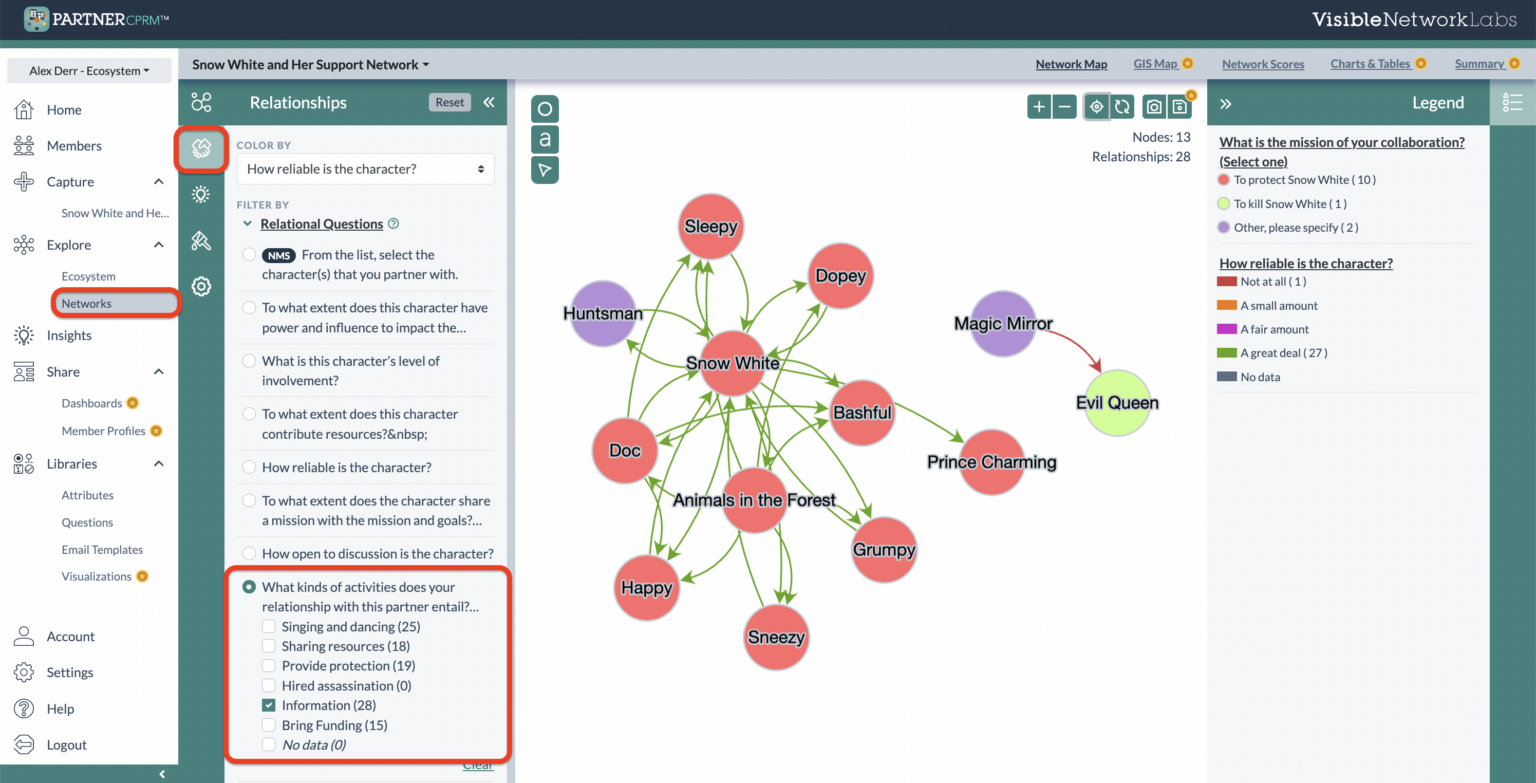
A map showing who shares information with others across Snow White and the Evil Queen’s networks.
Tip: If you do not see the Evil Queen and her partners, click the Node Filter Tab (the two-node icon) and ensure the box titled “Show Isolated Nodes” is checked.
This map shows where people are getting their information from across the entire network. While the Magic Mirror is providing the Evil Queen almost all of her information, it does not appear to think she is reliable, and they have different goals.
On the other hand, Snow White receives information from many members of her support network, whom she views as reliable and who shares a similar mission. She has the additional benefit of receiving information from the Huntsman, who shares a different mission but operates more closely with the Evil Queen than she does.
Questions to Consider:
How does the singular reliance on the Magic Mirror as an information source affect the Evil Queen’s decision-making capabilities? What are the risks associated with having only one primary source of information?
Given the diverse sources of information available to Snow White, how might this affect the accuracy and completeness of the information she receives?
How might having a common mission or goal, as seen with Snow White’s network, impact the reliability and authenticity of information being shared within that network?
How important is diversity in information sources for a network’s overall resilience and adaptability to changing situations?
Part 6: Next Steps
The best way to learn more and take the next step is a meeting with our team. To see the platform in more detail, request a live web demo. To discuss a research or evaluation project or idea with our team, set up a Discovery Session and we can discuss it. We look forward to connecting!
Try the Community Health Coalition Simulation
Apply these SNA methods and insights to real-world examples with our Community Health scenario. It demonstrates how a group of community organizations used PARTNER mapping to generate actionable insights from the perspective of six different stakeholders.
Additional Resources
Here are some additional resources for exploring your PARTNER CPRM free trial account.
Getting Started Guide
This Guide shows how to get started with your free trial account to add members and questions, collect relational data, and start mapping and analyzing it with PARTNER CPRM.
PARTNER CPRM Resource Library
Explore our full library of blog articles, infographics, research briefs, and webinars with best practices, how-to’s, and other advice and tips for getting the most possible of ecosystem mapping.
Help Center
Have a question for our team? Want to explore the full User Guide? Not sure what you’re looking for? Visit the PARTNER Help Center to access our Knowledge Base, community forum, and submit a support ticket to our team.
