PARTNER CPRM Interactive Demo:
Mapping a Community Health Coalition
This interactive demo allows you to analyze and interpret relational data using the PARTNER CPRM platform in a community context. Utilizing social network analysis and a sample dataset you can access in your free trial account, you can explore different roles and think analytically and strategically about decisions they might make as members of a community collaborative.
Table of Contents
Request a PARTNER Demo
Talk to a network expert and learn how PARTNER CPRM can change how you build networks.
Introduction
 State and local public health agencies face the challenge of collaborating with various partners to improve population health and share resources effectively. Such efforts now involve a wide range of entities beyond traditional healthcare, including schools and businesses. The complexity of health issues necessitates these multi-agency alliances, which are increasingly forming larger public health collaboratives to optimize resources and outcomes.
Public health departments struggle with how to effectively engage and evaluate partnerships in multi-agency collaboratives. Leaders in these collaboratives seek ways to measure success and resource allocation, posing questions about assessing their quality, impact on health outcomes, and accountability. A deeper understanding of collaboration dynamics and evaluation metrics is critical for enhancing the effectiveness of these public health initiatives.
This simulation demonstrates how social network analysis using the PARTNER CPRM platform can help public health departments and coalitions track, assess, and strengthen their relationships with community partners. Below is more info about the demo purpose, instructions, roles, and background information.
Demo Purpose
This simulation is designed to let you try using PARTNER CPRM and interpreting relational data from the perspective of a Community Health Coalition. It walks through the process of setting up a network, collecting relational data, mapping and interpreting the results, and sharing your findings with reports and profiles.
The simulation includes six different roles for the mapping and interpretation step to allow you to explore different ways PARTNER CPRM data can be analyzed and leveraged depending on your sector, collaborative role, and other unique factors and perspectives. The goal is to demonstrate the diverse ways to map and analyze a network and leverage your results for strategic decision-making.
Demo Instructions
This simulation should be completed with the PARTNER CPRM platform open in a second tab or window. Each section begins with directions on where to navigate within the platform and what you should see if you are in the right place. Then, you will have a series of questions to consider to practice interpreting relational data and engaging in strategic decision-making.
First, log in to your PARTNER CPRM account and open the Community Health Coalition Simulation from the homepage. If you don’t have an account, you can register here. The Simulation consists of six parts:
- Part 1: Learn how to bound your network and manage your members.
- Part 2: Walk through the process of creating and sending a network survey.
- Part 3: Practice mapping and visualizing your network and relational data.
- Part 4: Try engaging in strategic decision-making from six different unique perspectives.
- Part 5: Finish by creating a report with your findings and visualizations.
- Part 6: Shares two next steps to learn more and get started with PARTNER CPRM.
Questions? Email hello@visiblenetworklabs.com
Demo Roles
There are multiple roles in this simulation from the perspective of numerous community partners. This allows you to explore the various ways you can leverage relational data to guide strategic decision-making. These roles include:
- Grant Writer
- Public Health Department,
- Veterans Affairs,
- Job Training Center,
- Local Law Enforcement,
- The Homeless Shelter.
Part 1: Defining Your Membership
The first step for implementing PARTNER CPRM is defining and uploading the members of your network, coalition, or community ecosystem. In this community, the Public Health Department identified 11 organizations that are formally part of their Community Health Coalition. Once loaded in PARTNER CPRM they can sort and filter their Members within the Member Manager.
Directions:
- Log in to your PARTNER CPRM Account.
- Click “Account” on the bottom left.
- Under “Ecosystem Selection,” click “Community Health Coalition (Read Only).”
- Click “Captures” on the left side of the screen. Then click “Community Health Coalition – Simulation.”
- Click “Members” on the right side of the screen.
You should see the list of network members on the right.
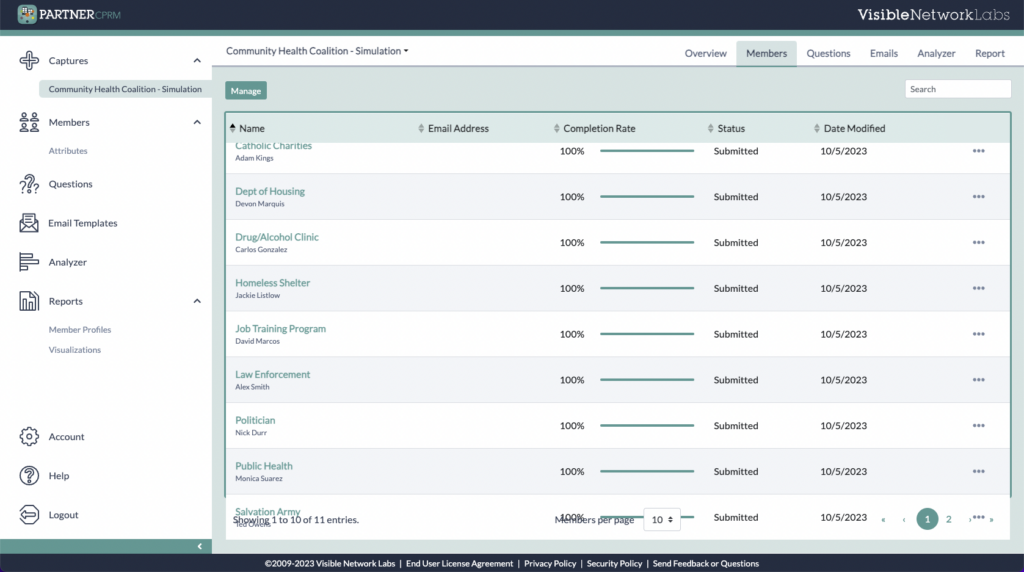
The Coalition’s member list
Part 2: Collecting Relational Data
With your network members uploaded you can consider what data you want to collect. This coalition is relatively young and decided to stick to a few essential questions to increase their response rate. You can view the survey they used by opening up the Questions section within the Data Capture.
Directions:
- Click “Questions” on the top right of the screen.
- Scroll down to review the network survey created by the Community Health Coalition.
- Click “Print View” on the top left to view the survey as a respondent would.
You should see the screen and survey like the one on the right.
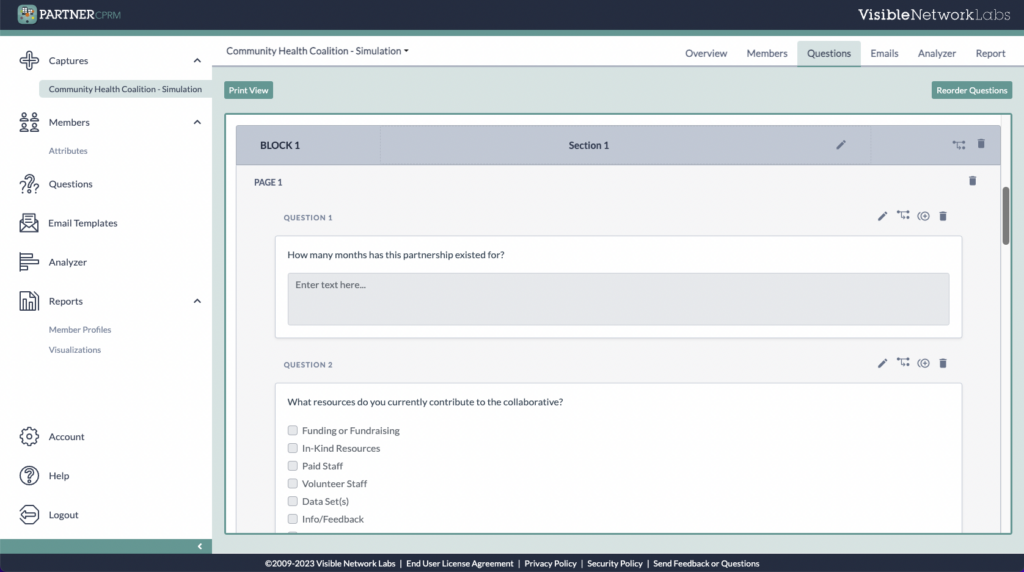
The survey used by the Network.
The survey is shared using PARTNER CPRM’s built-in email system and templates. Templates are created at the Ecosystem Level, and then scheduled at the Data Capture level. You can set three emails:
- Introduction email explaining why you are collecting relational data
- Invite email with a link to take your survey and answer your questions
- Reminder emails following up with those who have not participated
Each email can be scheduled to be set on a date and time of your choosing, with a specific template from your Ecosystem. You can view the email system by navigating to the Email section within the Data Capture.
Directions:
- Click “Emails” at the top right of the page.
- On the left, you can schedule emails by selecting an email type, delivery date and time, and the specific email template.
- The calendar on the right shows your currently scheduled emails.
You should see the screen and calendar like the one on the right.
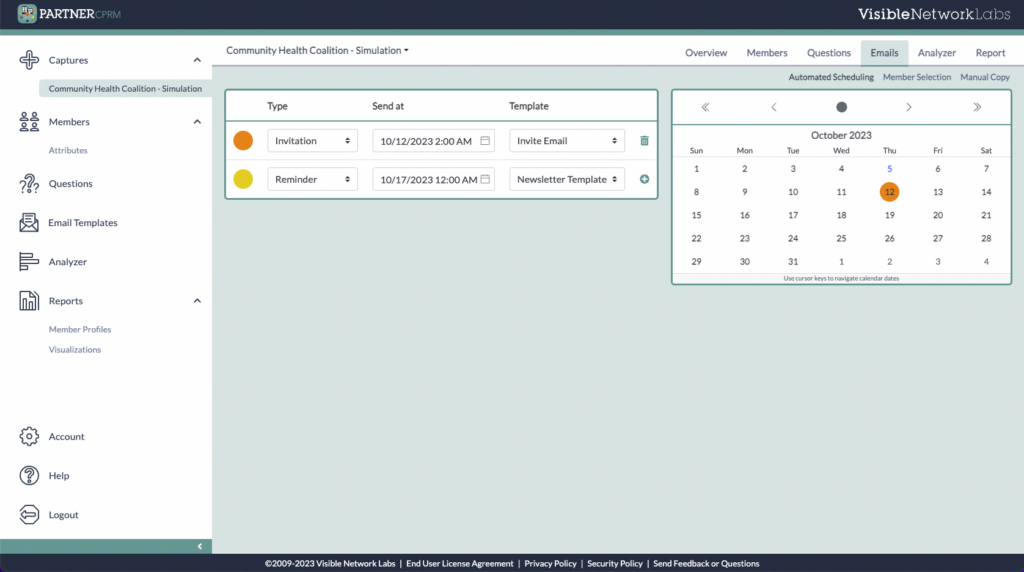
The coalition’s email settings.
Part 3: Exploring Your Network
After sharing their initial network survey with their coalition members, you can open the Network Analyzer at the Data Capture level to visualize and explore your relational data. This graphic demonstrates a few different ways you can analyze your network maps to identify actionable insights for your strategy.
This simulation step allows you to dig into the data yourself, conduct an initial exploratory analysis, and then interpret the network maps, charts, and scores from the perspective of several community organizations below.
1) Visualize the Network
This first glance at your community collaborative shows who works with whom across the network, where there are gaps, and who is more or less centrally connected. It is an excellent place to start to understand your network dynamics. Each section has directions on visualizing your network or access scores or charts, followed by some questions about the data and visualizations you see.
We recommend using two monitors for this simulation section, with the platform on one and this page on another, or switching between two tabs.
Directions:
- Log in to your PARTNER CPRM Account.
- On the welcome page, click “Community Health Coalition – Simulation” under “Get Started.”
- Click the “Community Health Coalition” under “Captures” on the top left of the screen.
- Click “Analyzer” on the top right of the screen.
- Open the node filters (network link icon) on the left. Under “Color By,” select “Sector.”
You should see the network map on the right.
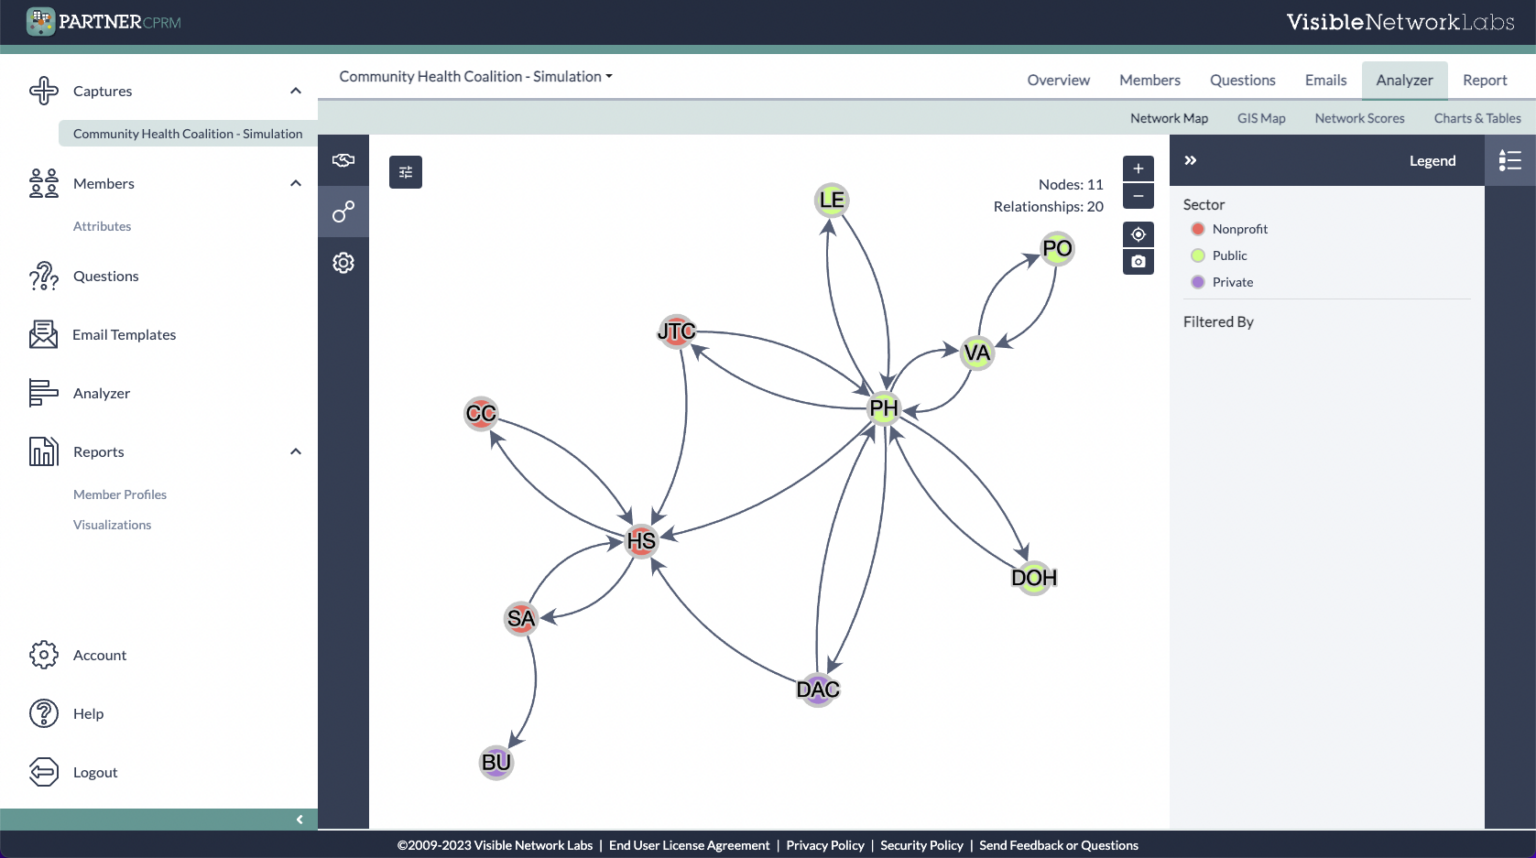
A network map of the Community Health Coalition
Questions to Consider:
- Describe the network, including who is working with whom.
- Who do you most commonly work with on the issue of homelessness?
2) Assess the Intensity of Relationships
These maps show how intense each relationship is, from awareness to integration. While intensity does not always equal quality, it is another way to understand the patterns and collaboration across your network. There are four levels of intensity, plus no relationship:
- No Relationship
- Cooperation
- Coordination
- Integration
Directions:
- Open the Relationship Filters” on the left (click the handshake icon).
- Under “Color By,” click the dropdown menu and select the ‘relationship intensity’ question.
- Use the controls on the right to zoom in and out and move nodes by clicking and dragging them. Use the node settings button to save or reset node positions.
You should see the network map on the right.
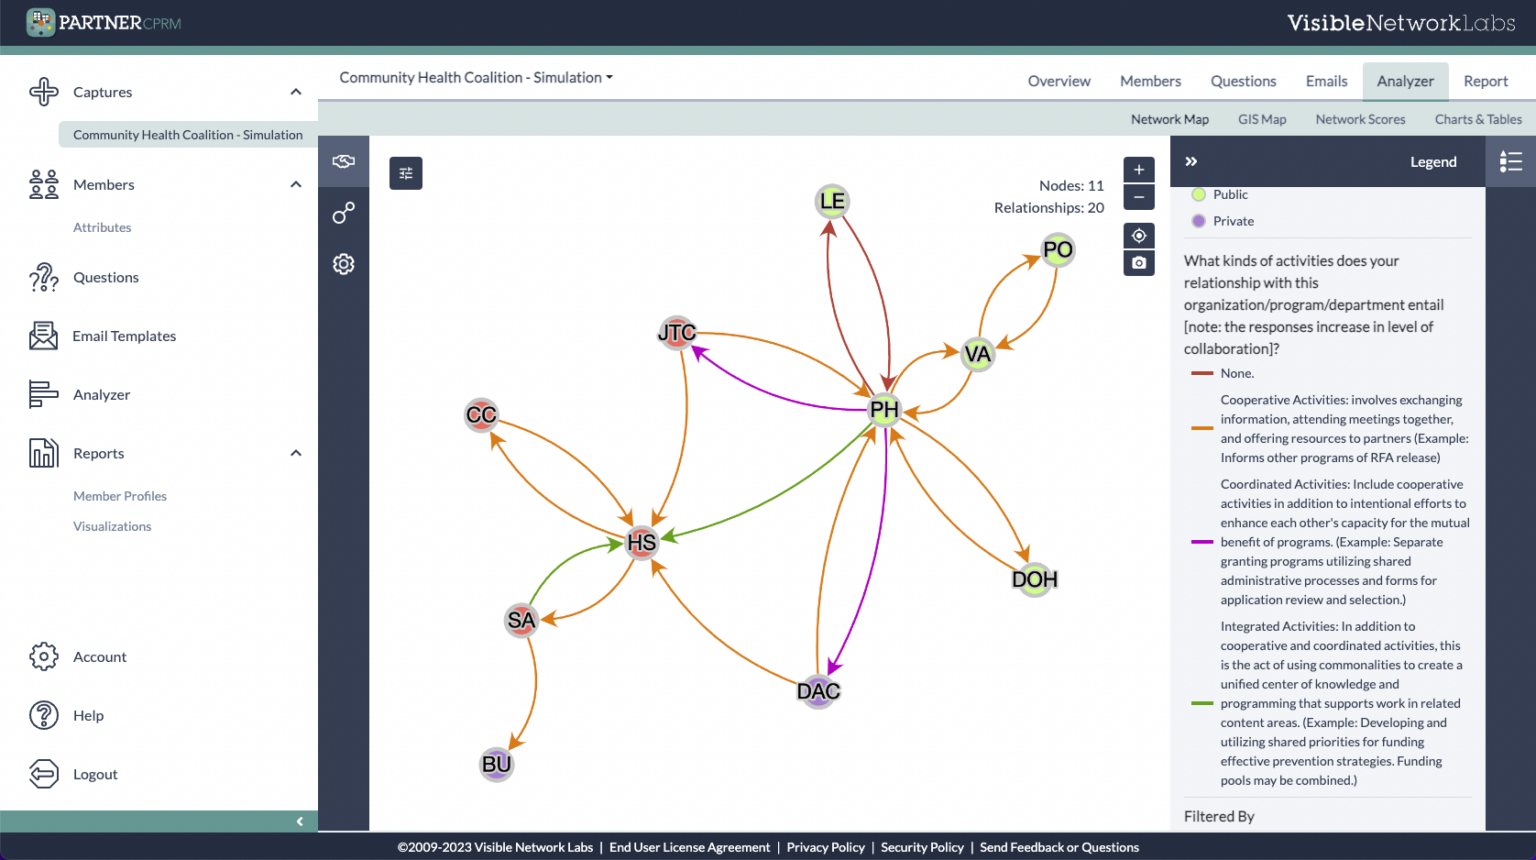
A network map of relationship intensity in the Coalition
Click each line color on the legend to the right to filter relationships by intensity. As lines disappear, you can get a sense of the intensity of the partnership between each set of networks. You can see which members cooperate, coordinate, or integrate, as well as those only aware of each other.
Questions:
- Which organizations have the most intense relationship?
- Which is the next most intense relationship?
- What can intensity tell you about the strength of the relationship?
- Who does your organization most and least intensely work with on issues related to homelessness?
3) Identify Community Resources
Auditing how your partners currently share and leverage resources across the network is a first good step. From there, you can identify ways to streamline and improve how resources are used and aligned across the community.
Directions:
- Click “Nodes” on the left (network link icon).
- Under “Color By,” click the dropdown menu and select the ‘most important resource contribution’ question.
- Change the labels, color, or size of nodes and the color or width of lines in the settings menu on the left (click the gear icon).
Each member’s most important resource contribution
Questions:
- What is your organization’s most important contribution?
- How can that contribution be leveraged and/or benefit the larger group?
- For the Grant Writer: How can resources be leveraged?
4) Assess the Strategic Value of Partners
Organizations are valued in coalitions when they bring a combination of power/influence, involvement, and resource. The “overall” score represents the average of all three scores. These characteristics are described as:
- Power and Influence: Collaborative members bring value to their PHC largely through their power and influence in the community. Such members hold prominent positions in the community, have influence as a change agent, and/or exhibit leadership.
- Active Involvement: Actively involved members not only participate in scheduled meetings, but actually accomplish tasks they agreed to take on.
- Resources: Valued partners bring resources to the collaborative, such as money, food and physical space for meetings, staff time, data, and educational materials. Some of the more intangible resources valued include knowledge, information, and feedback. Finally, community connections to other members is included on the list of valued resources.
Directions:
- Click “Nodes” on the left (network link icon).
- Under “Size By” click the dropdown menu and select “Overall Value.”
- You can also look at the three indicator questions: resource contribution, level of involvement, and power/influence.
You should see the network map on the right.
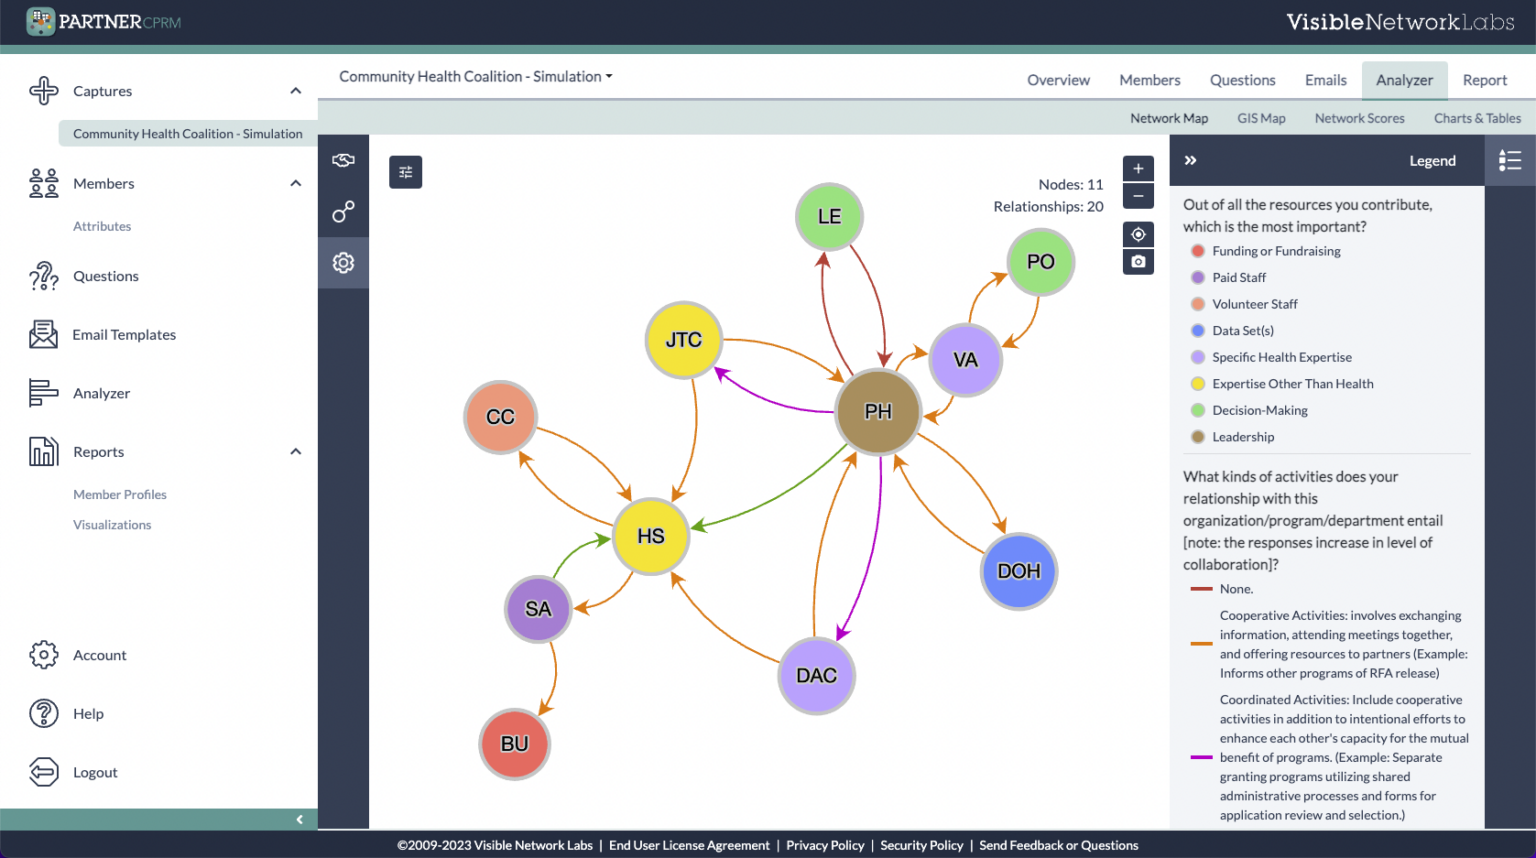
A network map of the coalition with nodes sized by value
The color of each node specifies what each organization believes is its most important contribution. You can step through the specific contributions to see what each organization brings to the collaboration.
As the nodes increase in size, the value (as perceived by the other members of the collaborative) of each characteristic increases. In other words, large nodes mean more value.
Questions:
- Which organizations are considered most powerful/influential, have the most level of involvement, and are having the most resource contribution?
- Are there certain valuable nodes that are “vulnerable” that is, not well connected that could be better connected through new ties?
- Along which dimension, if any, is your organization most valuable?
5) Measuring Trust Among Partners
Trust is the key to good collaboration: Trust is a dimension deemed critical to public health coalitions and partnerships. Trust is described here as:
- Partner Reliability: Being reliable and following through on your commitments and promises to other partners in the community coalition.
- Common Mission: Sharing a common mission with the group. Feeling a shared sense of purpose and alignment across your partners in terms of your core goals or objectives.
- Openness to Communication: Willing to engage in open, frank discussion even when disagreement exists or topics are controversial or disruptive.
Directions:
- Click “Network Scores” at the top right of the page, under “Analyzer.”
- Click “Network Scores” to see network-wide scores, and “Individual Scores” to see individual scores.
- You can also see the three trust indicator scores for reliability, openness to communication, and mission alignment.
- Sort the scores as ‘descending’ to see the most and least trusted organizations.
You should see the screen on the right.
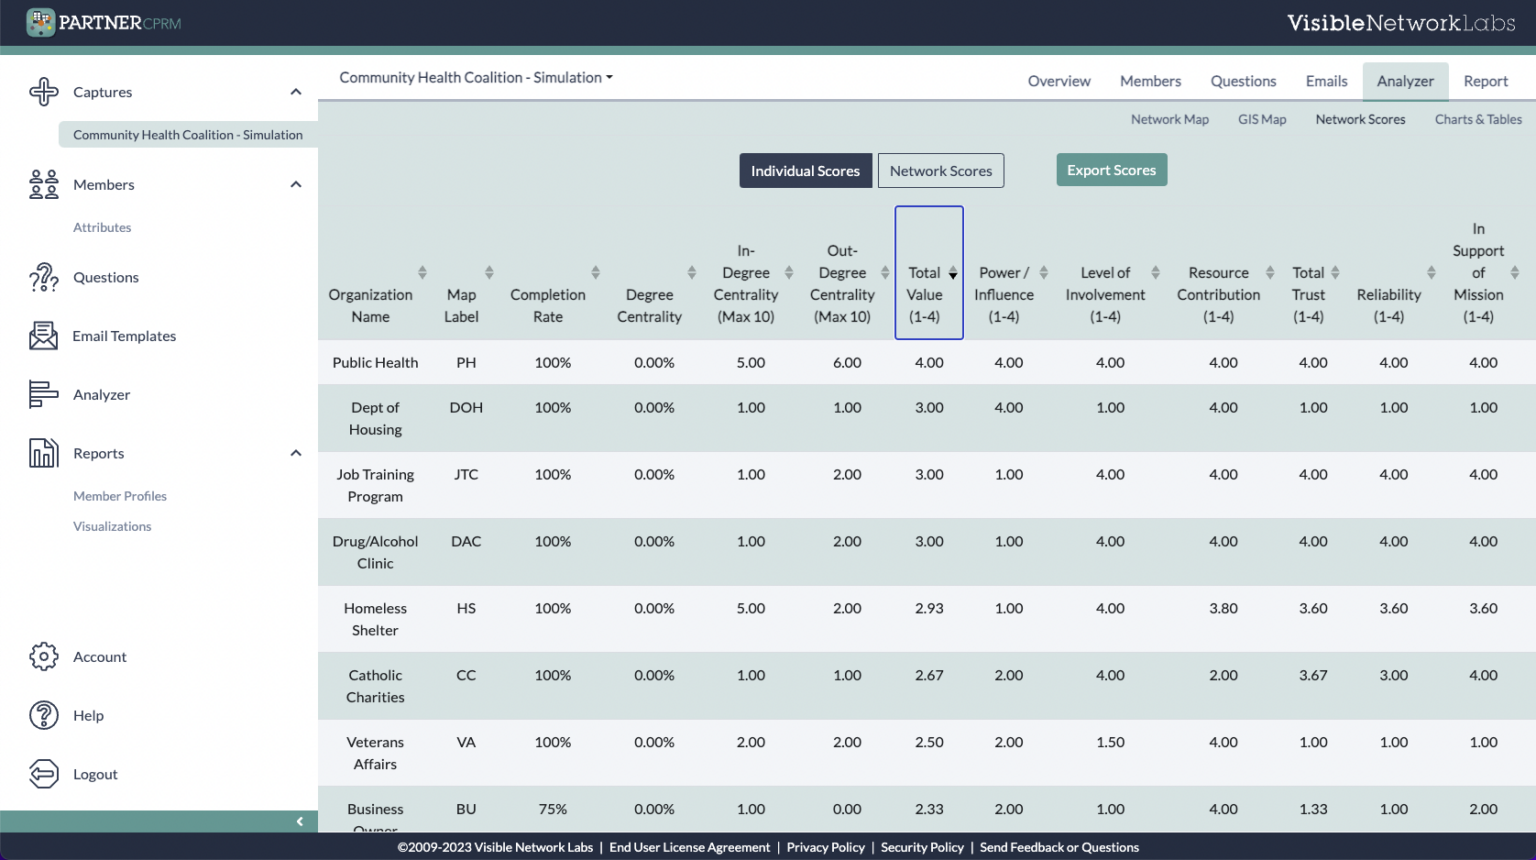
The Network Scores page with the Trust Column highlighted
These scores give more information about the network. The first box lists “whole network” scores – that is, scores that represent one total for the network. The second box lists scores by each organization. As you scroll, left to right, you can see the various individual scores. By sorting each column as “descending,” you can see which organizations have the highest to lowest scores.
Questions:
- What is the whole network score for trust?
- What does it mean?
- What is your own score for the three dimensions of trust?
- Are you very trusted by others, or not trusted as much?
6) Mapping the Network Geographically
Including GIS or address information for your partners allows you to map them geographically and generate place-based insights. This can help you assess whether you are reaching specific cities, counties, or neighborhoods and link your collaboration to population-level data with additional base layers.
Directions:
- Click “GIS Map on the top left of the screen, next to “Network Scores.”
- Zoom out on the map to view your entire network. Minimize the filter menu on the left if needed for a better perspective.
- Try using one of the node or relationship filters to add additional data layers by coloring or sizing nodes or relationships.
You should see the screen on the right.
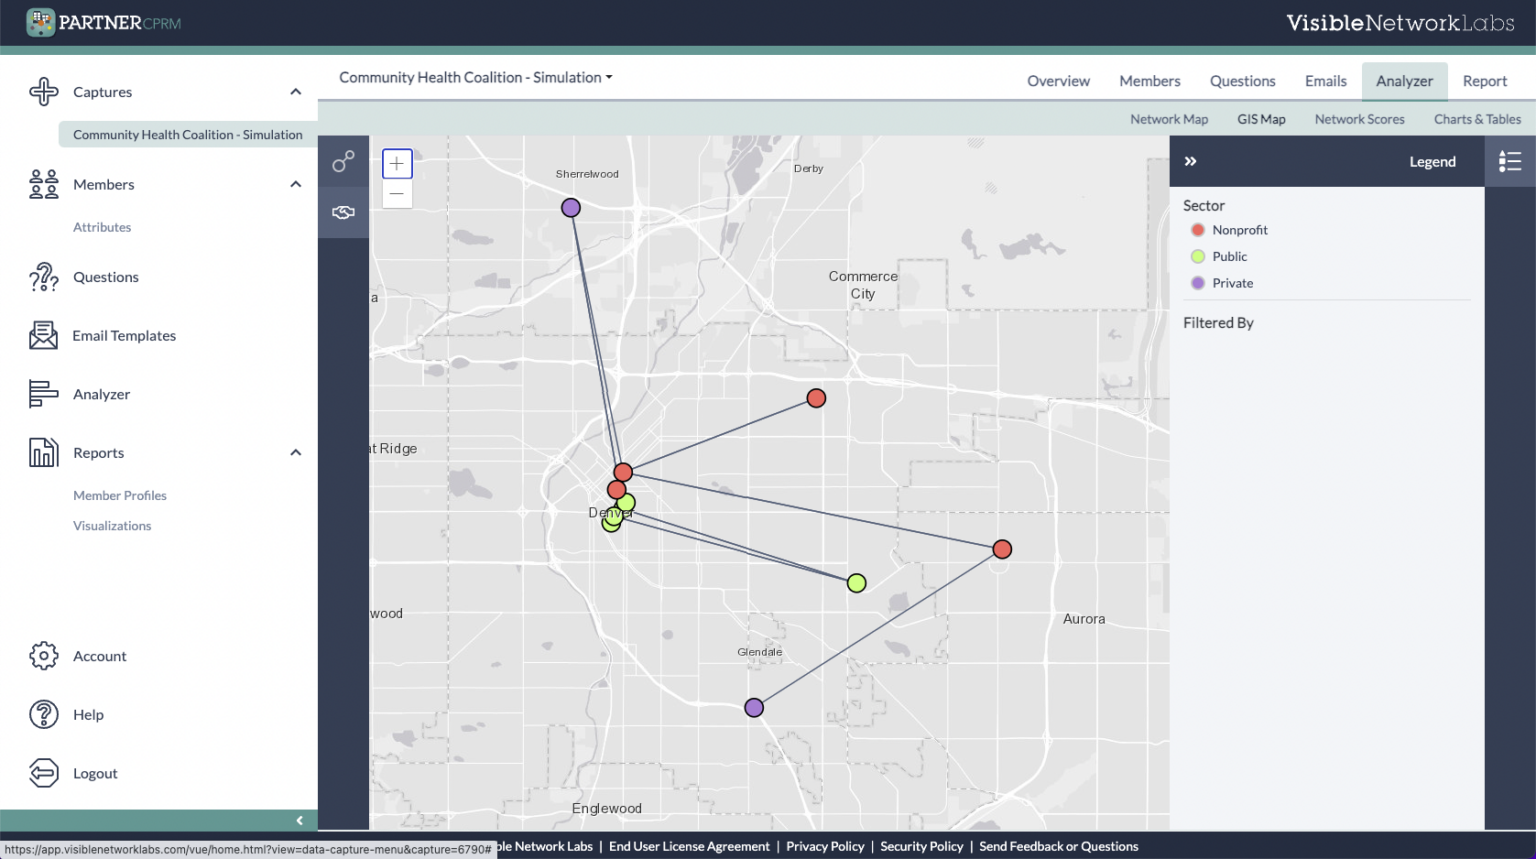
A geographic map of the coalition’s relationships
Questions to Consider:
- Which parts of the community are well-represented in the Coalition?
- What cities or neighborhoods have the biggest gaps?
- Are there any notable patterns in geographic representation when factoring in sector or focus areas?
7) Inventory Available Resources
Including GIS or address information for your partners allows you to map them geographically and generate place-based insights. This can help you assess whether you are reaching specific cities, counties, or neighborhoods and link your collaboration to population-level data with additional base layers.
Directions:
- Click “Charts & Tables” on the top right of the screen, next to ‘Network Scores’.
- Click “Data Options” on the left to open the settings.
- Click “Bar Graph” on the top left.
- Under “Show Results Based On,” select the ‘resources you contribute’ question.
You should see the screen on the right.
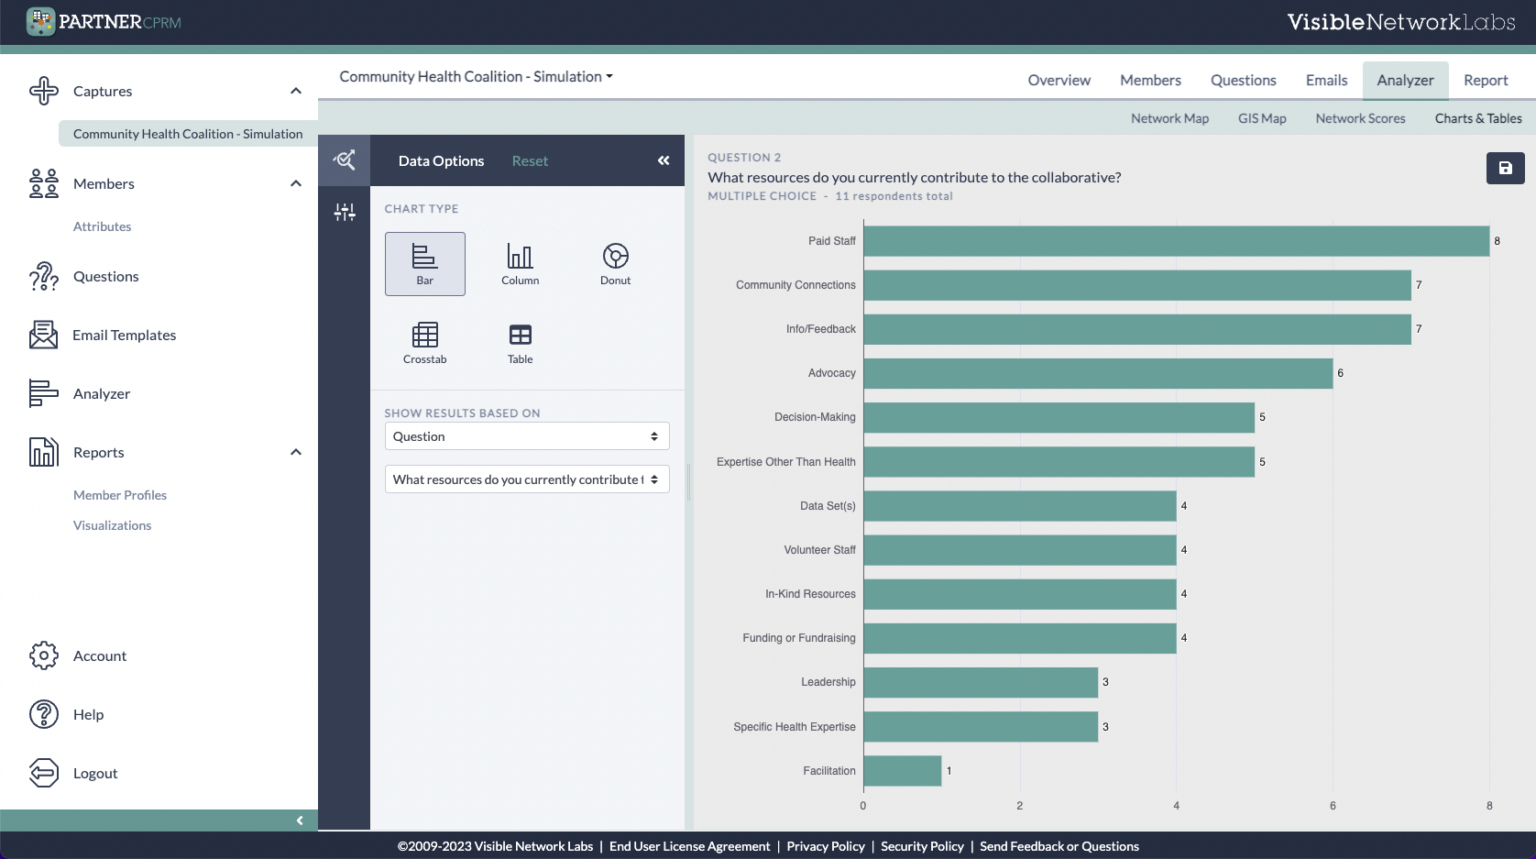
A graph of the coalition’s available resources
Questions to Consider:
- Which resources are most common in the network?
- What types of resources are most scarce? Are we using them effectively?
- Do the available resources meet our needs? If not, who might we involve who can address these gaps?
Part 4: Making Strategic Decisions
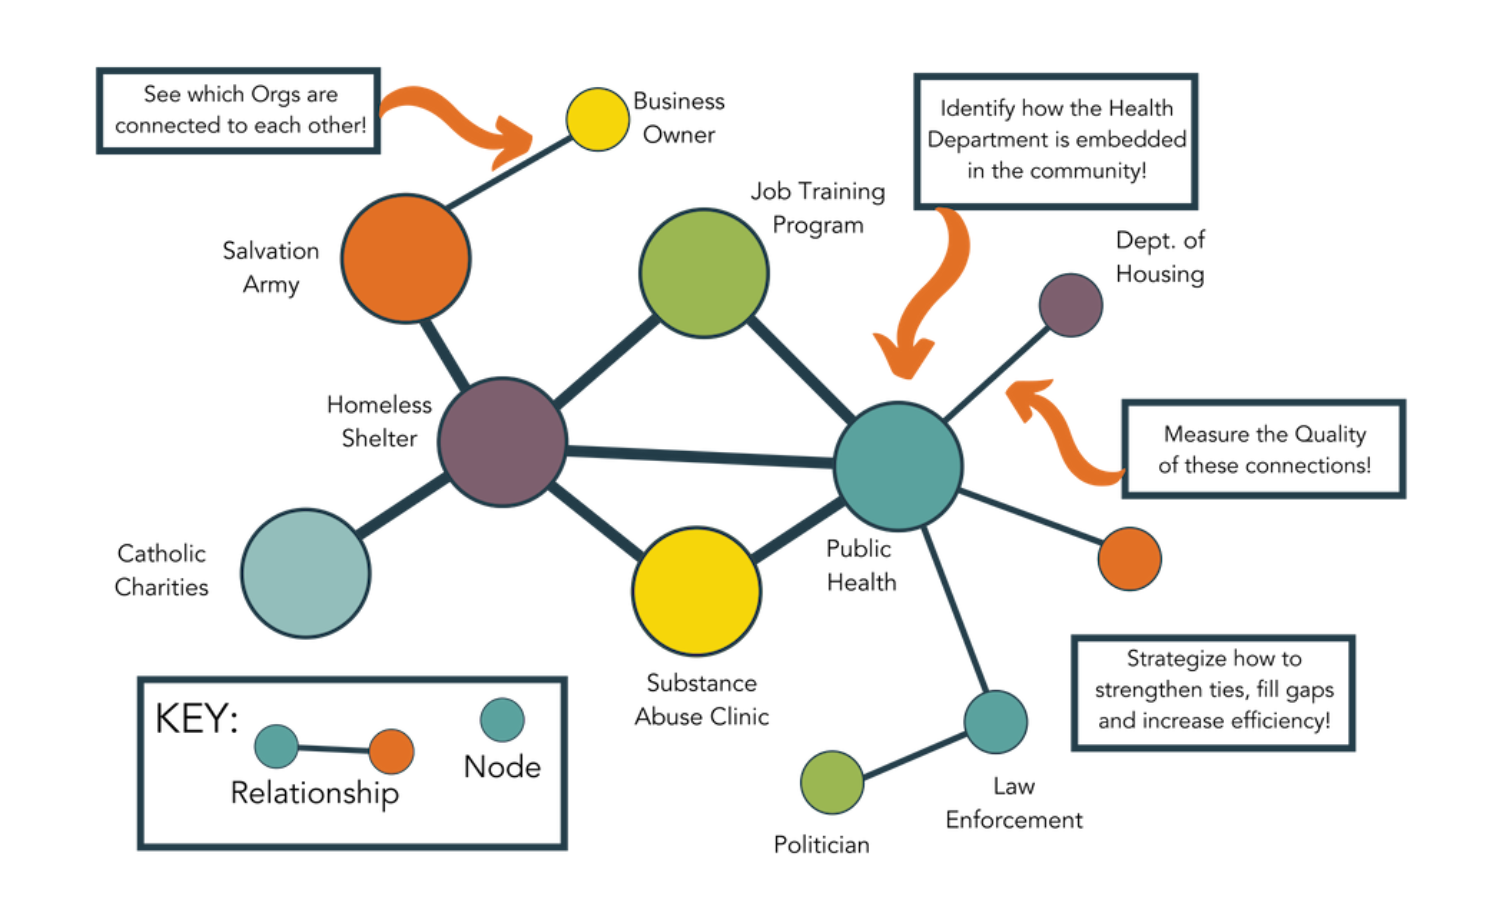
In the following section, the various motivations of each role are described. Each participant is asked to make strategic decisions based on their motivations, using information from the PARTNER program. In addition, the network map in Appendix 1 can be used by each participant to describe their strategies.
I. Grant Writer
Funding to support programming for homelessness is available through HUD, SAMSA, and HRSA; however demonstration of “collaborative efforts” among community organizations is a required competency in any of the funding proposals.
The grant writer will use PARTNER to demonstrate the level of connectivity among members by describing the following:
Network Membership
Diversity is considered a strength of community collaboratives.
The grant writer should look at the “Legend” from the first visualization they produced to describe the different sectors represented within the collaborative. They can also change “Color By” to “Primary Org Function” to see the different areas of focus across the network.
The grant writer should explain why diverse sets of organizations can improve the collaboratives’ ability to succeed.
Relationship Intensity
Intense relationships are not always necessary for good connectivity. While most research concludes that more intense interactions and collaboration among organizations improve outcomes, not everyone agrees, given the increased demand on time, budgets, and resources.
We recommend that networks try to take a balanced approach, with some relationships at the integrated level, some at the cooperating level, and most at the coordination level.
The grant writer should discuss how the varying levels of relationship intensity can demonstrate a sufficient level of involvement (for example, is it necessary for Law Enforcement to participate at a higher level of intensity) and also suggest areas for improvement.
Network Density
The density score can be found in “Network Scores.” Density can tell you how “connected” the network is. The more dense a network, the more resilient it can be. Additionally, information can flow more easily through the network when everyone is more densely connected.
The grant writer should explain what the density score means and how the funding can help improve the score.
II. Public Health Department
The public health department currently plays a key role in the collaborative. While the dominant view among each member is that health departments should play a strong coordinating function in PHCs, they also feel strongly that public health should not be expected to stay in the coordinating position forever.
Many feel that the role of health department is not static and that, over time, they eventually should be able to assume a role as equal partner so that the collaborative can function with a more decentralized configuration. While the motivation of the public health department is to continue to promote work on homelessness, they are hopeful to transition out of the coordinating position and shift this responsibility to another key member of the group.
Key Player Roles: Degree Centrality
The network score called “Degree Centrality” (found under “Network Scores” within the Network Analyzer) tells us who has the most number of connections to others.
After arranging the scores in columns as “Descending”, the Public Health Department can see who has the highest “degree centrality” scores.
Leadership Based on Trust
Trust is an important element to community collaboration. The “total trust” score (found under “Network Scores” within the Network Analyzer) tells us how much, overall, each organization is trusted by the others.
The public health department should describe who the current members are with high degree centrality scores and who might be the natural replacement for the public health department, based on the least amount of resources to put an organization in that position.
The public health department should describe, based on the “Total Trust” score, which organizations would best be suited to lead the collaborative? Which organizations would be least suited, based on this score?
III. Local Law Enforcement
Local law enforcement’s motivation for involvement in the homeless collaborative is to understand the extent of the homeless population, their needs, and how to better handle homeless people found on the streets. Local law enforcement is hopeful that they can learn from case management professionals about how to distinguish types of possible mental illness and learn about alternatives for treatment (as an alternative to taking homeless people to jail).
The goal of Local law enforcement is to increase their connectivity (number of connections and frequency of interaction) with organizations that have knowledge in this subject. They are particularly interested in homeless veterans.
Increasing Connectivity:
Local law enforcement is trying to decide who would be the best organizations to connect with to meet their goals. While their intentions are good, they don’t have many resources to commit to this endeavor. They are hopeful that by connecting to just a few others, they can improve their overall connectivity to the group.
Local law enforcement has the resources to increase connectivity with two other organizations. Using the network graph in Appendix 1, they need to identify which two organizations can best improve their connectivity to groups with expertise they need. The goal is to connect with the two best organizations most connected to others they need information from. In other words, they are trying to identify the “brokers” of information. Explain which organizations they should pick, and why.
IV. Homeless Shelter
The homeless shelter has many motivations for getting involved in a community collaborative. Number one on its list though is how to get more resources to increase the number of beds and services provided to homeless people while in the shelter or transitional housing. Second on the list is to find ways to increase public awareness and political support for the needs of the local homeless population. The goal is to increase connectivity with as many organizations as possible.
Increasing Connectivity:
The homeless shelter is trying to decide who would be the best organizations to connect with to meet their goals. While its intentions are good, they don’t have many resources to commit to this endeavor. The shelter is hopeful that by connecting to just a few others, it can improve its overall connectivity to the group.
Identify Additional Resources for Beds and Case Management Services
To find out who has the resources they need, the homeless shelter can use the “resources” information to make this decision. They are specifically looking for organizations with “Funding or Fundraising,” “In-Kind Resources,” “Volunteer Staff,” and “Expertise Other Than in Health.”
This can be found by going to the Network Map, clicking the “Node Filters,” clicking “Non-Relational Questions, “and selecting each of these options under “What resources do you currently contribute to the collaborative? This will filter out other options and leave only those members who selected the resources of interest.
Which organizations might have the kinds of things that the homeless shelter can use?
Increase Public Awareness and Support
The homeless shelter knows that it will need to tap into the resources of those that have a high level of power/influence.
The homeless shelter needs to identify how many new connections they will have to foster in order to meet their goals. Organizations they hope to connect with will have high Value scores on power/influence.
This can be found by going to the “Network Scores” page within the Network Analyzer. Select “Individual Scores” and look for the Power/Influence column.
The goal is to connect with as many organizations in order to reach this goal. Which organizations are the best to form connections to and why? What techniques can they use to form connections and educate these other members?
V. Veterans Affairs
The local VA has identified homelessness as one of its priority areas to address. While the number of homeless veterans increases in the community, the role of the VA in alleviating this problem has decreased in recent years. The VA has a number of services to offer to veterans, thereby freeing up community resources for non-veterans.
However, the public has a low level of trust for the VA and is unaware of its services. By forming a partnership with the public health department, the VA has already begun to build a partnership on its way to becoming a stronger community presence around the issue of homelessness. The motivation of the VA is to extend their services to the larger population of homeless veterans and build trust throughout the collaborative.
Extending Services
The VA knows that it has to take small steps and not appear over bearing informing new connections for resource sharing. As a first step, the VA has decided to reach out to those in the collaborative who are considered valuable for their “level of involvement.” They hope to educate these other organizations about their services and motivations, and increase the intensity of the relationships between themselves and these members.
The VA needs to identify which new connections they can foster in order to meet their goals. Organizations they hope to connect with will have high Value scores on “level of involvement.” This can be found by going to the Network Analyzer. Click the Node Filters an under “Size By,” select “Level of Involvement.” The largest nodes have the highest level, small nodes have the lowest level.
The goal is to connect with as many organizations in order to reach this goal. Which organizations are the best to form connections to and why? What techniques can they use to form connections and educate these other members?
Building Trust
Next, the VA wants to build trust among the larger community of organizations working on these issues. They believe that it will be easiest to build trust first with organizations that are from the same sector as they are (public sector). They want to identify other public sector organizations.
The VA should look at the “Group Key” from the first visualization they produced to describe the different sectors represented within the collaborative. This is found in the Network Analyzer. Click the Node Filter icon, and under “Color By,” select “Sector.”
These include the nonprofit, public, and private sector. The VA will want to first connect with organizations from the public sector. Using the network map, describe how the network will change (where new ties will be formed) once they take this action.
VI. Job Training Center
The job training center’s purpose is to provide training in skills that can help homeless people attain permanent jobs in the community. They are anxious to connect to organizations that can provide client referrals as well as provide funding to support those individuals (the Job Training Center is a private organization). A barrier however is that they must have buy-in from decision-makers in the group to market their services to other organizations. Their strategic goal is to increase connectivity with organizations that have funding, data, and decision-making
Increasing Connectivity
The job training center is trying to decide who would be the best organizations to connect with to meet their goals. They understand that their actions must be strategic, so as not to compromise their position in the collaborative.
To find out who has the resources they need, the job training center can use the “resources” information to make this decision. They are specifically looking for organizations with “Funding,” “Data,” and “Decision-Making.” This can be found by going to the Network Analyzer. Click and open the Node Filters on the left. Click “Non-Relational Questions” to view your options, and under the resource contribution question, check each of the resources of interest: funding, data, and decision-making. The node still visible contribute one of these resources.
You can click each node to view more information and details. Which organizations have all three of the resources that the job center is looking for in an organization? Which should the job center approach first, and why?
Leveraging Brokers
The job center next decides that it would like to set up one meeting to introduce itself to all of the potential organizations that might help it meet its goals.
Among the organizations identified above, the job center wants to select the most trusted one and solicit them to host a meeting on the job center’s behalf. Which organization would be best for this role? Is there an advantage to picking an organization that they do not already have a relationship with, or should they try to solicit someone new?
To explore this, go to your Network Scores within the Network Analyzer. Click “Individual Scores” and look for the Trust column. Sort the scores in descending order to see who has highest trust scores.
Part 5: Sharing Reports & Profiles
Once the network finishes its analysis and interpretation of its network maps and data, they can prepare reports and profiles to share their findings with their partners and stakeholders. The PARTNER CPRM Report Builder allows you to create a series of automated reports using the newly rolled out template feature.
Report templates are created at the Ecosystem level, and then used to generate reports at the Data Capture level. To see an example of a Full Report created by the Community Health Coalition to share their results, follow the directions below.
Directions:
- Click “Report” on the top right of the page.
- Scroll through to view all the Survey Results.
- Click “Download PDF” at the top right to save the sample report on your computer.
You should see the screen on the right.
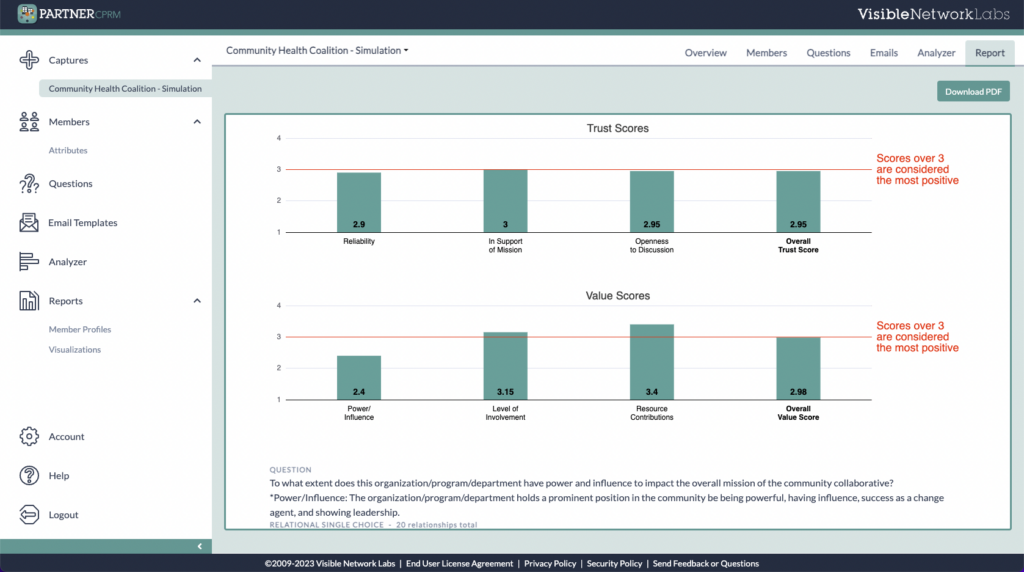
The Full Report Trust and Value Scores
Part 6: Next Steps
The best way to learn more and take the next step is a meeting with our team. To see the platform in more detail, request a live web demo. To discuss a research or evaluation project or idea with our team, set up a Discovery Session and we can discuss it.
We look forward to connecting!
Request a Web Demo
Explore the PARTNER CPRM platform with a specialist from our team to get your questions answered.
Setup a Discovery Session
Meet with a network science expert from our Data Science and Insights Team to discuss a project.
Additional Resources & References
- Levin BW. Public Health Bioethics: The Benefits of Collaboration. American Journal of Public Health. 2002;92(2):165-167.
- Provan KG, Nakama L, Veazie MA, Teufel-Shone NI, Huddleston C. Building community capacity around chronic disease services through a collaborative interorganizational network. Health Education & Behavior. Dec 2003;30(6):646-662.
- Lasker RD. Broadening Participation in Community Problem Solving: a Multidisciplinary Model to Support Collaborative Practice and Research. Journal of Urban Health. March 2003;80(1).
- Valente TW, Chou CP, Pentz MA. Community coalition networks as systems: Effects of network change on adoption of evidence-based prevention. American Journal of Public Health. 2007;97(880-886).
- Handler A, Issel M, Turnock B. A Conceptual Framework to Measure Performance of the Public Health System. American Journal of Public Health. August 2001;91(8):1235-1239.
- Luke DA, Harris JK. Network Analysis in Public Health: History, Methods, and Applications. Annual Review of Public Health. 2007;28(16):1-25.
- Evans RG, Stoddart GL. Producing health, consuming health care. Social Science & Medicine. 1990;31(12):1347-1363.
- Nicola RM, Hatcher MT. A framework for building effective public health constituencies. Journal of Public Health Management and Practice. 2000;6(2):1-10.
- Scott, J. 1991. Social Network Analysis: A Handbook. London: Sage Publications.
- Varda, D. M., A. Chandra, S. Stern, and N. Lurie. “Core Dimensions of Connectivity in Public Health Collaboratives” Journal of Public Health Management and Practice. 2008; 14(5): E1-E7.
- Varda, D. M., A. Usanov, A. Chandra., and S. Stern. PARTNER (Program to Analyze, Record, and Track Networks to Enhance Relationships. RAND: Santa Monica. 2008
- Granovetter MS. The strength of weak ties. American Journal of Sociology. 1973;78(6):1360-1380.
- Burt RS. Structural Holes: The social structure of competition. Cambridge: Harvard University Press; 1992.