
Community Asset Mapping is an essential tool for anyone looking to build stronger, more connected, and more resilient communities. Rather than focusing on deficits or gaps, this strengths-based methodology helps identify and map the resources, relationships, and capacities that already exist—offering a more empowering path to community change.
Whether you’re starting a new initiative, seeking funding, or fostering cross-sector collaboration, asset mapping can help you unlock the potential already present in your community.
✅ Quick Summary: What is Community Asset Mapping?
- Community asset mapping is a strengths-based approach to community development that maps people, places, and relationships that already add value.
- Rooted in the Asset-Based Community Development (ABCD) model, it prioritizes what communities have rather than what they lack.
- It identifies individual, institutional, and associational assets, as well as relational assets like trust, influence, and alignment.
- It’s especially powerful when done with community participation, not just for analysis.
- Tools like PARTNER CPRM allow you to map both tangible and intangible assets using social network analysis, helping you see not just what is there—but how it’s connected.
Table of Contents
What is Community Asset Mapping?
At its core, community asset mapping is about seeing the full picture of a community—not just what’s broken, but what’s working. It’s a process of discovering the human, social, organizational, cultural, and physical resources that can be mobilized for positive change.
Examples of community assets include:
- People with unique talents, professional skills, cultural knowledge, or lived experience.
- Organizations and institutions such as schools, clinics, food banks, local businesses, and advocacy nonprofits.
- Community associations like sports leagues, faith groups, or neighborhood watch programs.
- Public spaces and infrastructure including parks, transit lines, community centers, and libraries.
- Social capital—the trust, influence, collaboration, and alignment among people and organizations.
The process is often visualized using maps, charts, or diagrams that help uncover how these assets relate to each other—and how they can be activated to meet local needs or goals.
The Foundation: Asset-Based Community Development (ABCD)
The methodology behind asset mapping was developed as part of the Asset-Based Community Development (ABCD) model, created by John Kretzmann and John McKnight at Northwestern University. Their work laid the foundation for a different way of working with communities—one that’s participatory, empowering, and fundamentally optimistic.

Get our monthly newsletter with resources for cross-sector collaboration, VNL recommended reading, and upcoming opportunities for engaged in the “network way of working.”
ABCD Prioritizes:
- Community-led efforts over top-down programs
- Capacity-building rather than charity
- Relationship-building as a means to systemic change
- Redistribution of power, not just distribution of resources
Where traditional needs assessments often list community problems (e.g., high unemployment or crime), ABCD asks: What capacities and assets exist that could address these problems? Asset mapping is the tactical expression of this philosophy.
Types of Community Assets
Asset maps typically include several categories of assets. Let’s take a closer look at the main types of community assets involved with mapping.

🧑🤝🧑 Individual Assets
These are the people-powered strengths of a community:
- Skills and trades (e.g., electricians, teachers, organizers)
- Cultural or artistic talents
- Lived experience (e.g., navigating homelessness, addiction recovery)
- Personal relationships and local knowledge
- Language fluency, storytelling, and leadership qualities
Even individuals who aren’t formally employed can be vital community assets—especially when engaged as co-creators of solutions.

🏛️ Institutional Assets
These are the formal structures that provide services or opportunities:
- Educational institutions (e.g., schools, colleges)
- Health services (e.g., clinics, hospitals, public health departments)
- Local businesses, employment centers, and chambers of commerce
- Nonprofit and government agencies

🤝 Citizen Associations
These are groups formed around shared interests, identities, or goals:
- Religious congregations
- Youth sports leagues and parent-teacher associations
- Mutual aid and volunteer networks
- Cultural organizations and grassroots coalitions

🌳 Physical Assets
This includes the built and natural environment:
- Housing and public buildings
- Parks, trails, gardens, and open space
- Transportation routes and bike lanes
- Broadband and technological infrastructure

💬 Relational Assets
Arguably the most overlooked—yet most influential—assets are the relationships between people and organizations.
- Trust: Do stakeholders believe in each other’s intentions and reliability?
- Influence: Who can mobilize others or make decisions?
- Alignment: Are missions and strategies pulling in the same direction?
- Collaboration: Where are partnerships already happening—or could be built?
Relational assets are essential to systems change and are best captured through network analysis tools, not just maps or lists.
Why Do Community Asset Mapping?
There are many strategic reasons to use asset mapping. Some of the most common include:
✅ Starting New Initiatives
Before starting something new, it’s critical to understand what’s already in place. This avoids duplication, identifies partnership opportunities, and ensures new efforts complement existing efforts.
📊 Writing Grants or Proposals
Funders increasingly want to see that communities have the capacity to succeed. An asset map showcases local strengths, networks, and readiness for collaboration.
🗺️ Supporting Planning and Strategy
Asset maps help decision-makers understand where services are clustered, where there are gaps, and how to deploy resources equitably.
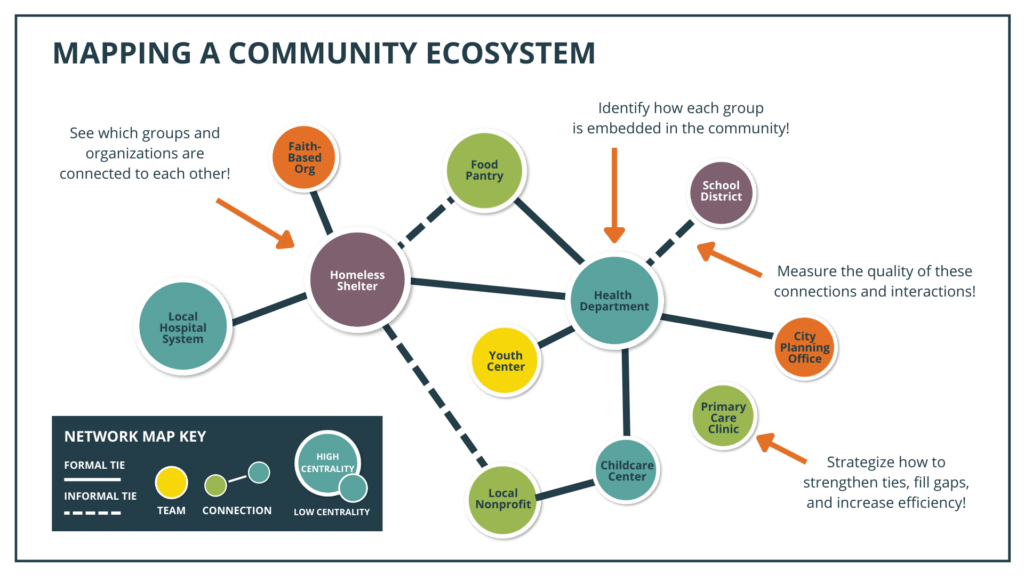
🤝 Building Better Systems
By visualizing how different stakeholders are connected—or disconnected—you can identify high-value partnerships to pursue or support.
🔍 Identifying Gaps
Asset mapping doesn’t ignore what’s missing—it helps communities understand how to bridge gaps using existing strengths or build new capacities.
How to Do Community Asset Mapping: A Step-by-Step Overview
Community asset mapping can range from quick-and-dirty sketches to sophisticated, data-rich visualizations. Regardless of your tools or timeline, the real power lies in revealing and mobilizing community strengths. Here’s a practical, six-step framework to guide your process—flexible enough for any context, from grassroots coalitions to city-wide initiatives.
1. Define the Community
Start by clearly identifying the boundaries of your “community.” This could be:
Geographic: a neighborhood, school district, city, or region.
Demographic: specific populations like youth, seniors, or immigrant communities.
Thematic: coalitions, organizations, or networks centered on a shared goal or issue (e.g., food security, health equity).
🛠 Tip: Be explicit about your definition—it shapes what you look for and who you include. Map stakeholders in and on the edge of your defined area to understand your ecosystem’s full reach.
2. Determine Your Goals
Clarify why you’re mapping. Your purpose determines your process. Examples include:
Strategic Planning: Discover who’s already working on your goals.
Grant Readiness: Showcase existing assets and collaborations to funders.
Program Launch: Identify gaps and partners to ensure alignment.
Policy Advocacy: Build coalitions and show community capacity.
Network Building: Strengthen collaboration and reduce duplication.
🎯 Advice: Set both short-term and long-term goals. This ensures your mapping efforts don’t just end in a report but actually support strategic action.
3. Identify Asset Categories
Decide what counts as an “asset.” Typical categories include:
Individuals: leaders, volunteers, connectors, storytellers.
Organizations: nonprofits, businesses, schools, faith-based groups.
Physical Spaces: parks, libraries, clinics, community centers.
Networks & Coalitions: formal or informal groups sharing knowledge or resources.
Intangible Assets: trust, influence, lived experience, and cultural traditions.
📋 Tip: Co-define assets with your stakeholders. Their perspective will uncover hidden or unconventional strengths you might miss.

4. Engage Stakeholders
Authentic engagement uncovers richer data and builds shared ownership. Depending on your timeline and resources, you can:
Host focus groups to generate discussion.
Conduct one-on-one interviews to dive deep.
Run participatory mapping sessions using printed maps or whiteboards.
Launch digital surveys to scale quickly.
🤝 Pro Advice: Always ask: Who isn’t at the table, and why? Intentionally include voices that are often left out—youth, elders, people with lived experience, frontline workers.
5. Map and Visualize the Data
Choose the format that fits your goals and audience:
Low-tech: Sticky notes on butcher paper, printed maps with pins, Excel grids.
Mid-tech: Online whiteboards like Miro, collaborative Google Maps.
High-tech: Platforms like PARTNER CPRM to visualize networks, track relationships, and analyze trust, influence, and alignment.
🗺 Pro Tip: Focus on clarity, not complexity. A simple, clean map that sparks discussion is more useful than an overly detailed one that overwhelms.
6. Interpret and Act
Now the most important part—turning maps into momentum. Analyze your data to:
Spot underused assets that could be activated.
Identify gaps or silos where more connection is needed.
Uncover influential connectors who could bridge networks.
Surface trust issues or alignment mismatches to address proactively.
📈 Next Steps: Turn your findings into action plans—host a community convening, draft a funding proposal, or launch a pilot project. Keep the loop going by revisiting and updating your map regularly.
This six-step process aligns with multiple types of community asset maps, including GIS-based visualizations, system maps, and social network maps. Each format can provide unique insights, especially when layered together—which we’ll cover next.
💡 Pro Tip: Start small, go deep!
If you’re limited on time or capacity, begin with a micro-pilot: map assets in one school, block, or coalition subgroup. This allows you to refine your tools and build quick wins that can justify scaling later. Momentum beats perfection every time.
Types of Community Asset Maps
There are many different methods and approaches you can choose from to collect data and construct a community assets map. Here are five of the most common routes taken.
1. Participatory/Community-Led Mapping
This approach puts community members in the driver’s seat. Residents, stakeholders, or community groups co-lead the identification, documentation, and interpretation of assets, often using storytelling, facilitated workshops, or creative methods like photovoice and drawing maps.
🟢 Strengths:
- Builds trust and shared understanding
- Centers lived experience
- Creates buy-in and legitimacy
🔴 Watch-outs:
- Can be time-intensive
- Requires facilitation skills and trust-building
- May need support to integrate outputs into formal planning
💡 Pro Tip: Use low-tech tools to boost accessibility!
Paper maps, stickers, dot-voting, and storytelling circles are not just low-budget—they also reduce intimidation and increase engagement among participants who may distrust formal data collection processes.

2. Institutionally-Led Mapping
In this more top-down approach, a lead organization or agency conducts the mapping (often using staff or consultants) and then engages community partners to validate or add context. Data may be gathered through surveys, interviews, or inventories.
🟢 Strengths:
- More control over data quality and scope
- Easier to align with organizational goals
- Can scale more quickly
🔴 Watch-outs:
- Risk of missing community-defined assets
- Can reinforce power imbalances if not coupled with engagement
- May produce static results without deeper reflection

3. Mixed-Methods Mapping
This hybrid model blends quantitative and qualitative methods, integrating structured data collection (e.g., surveys, GIS, SNA) with participatory methods like focus groups, asset walks, or storytelling. The goal is to capture both the “what” and the “why” behind assets.
🟢 Strengths:
- Provides a fuller picture
- Validates and enriches quantitative data
- Balances rigor with inclusion
🔴 Watch-outs:
- More complex to design and analyze
- Requires cross-functional collaboration and multiple skillsets
- Can overwhelm stakeholders if not synthesized well
💡 Pro Tip: Pair your methods with your message!
Want to persuade funders? Include hard metrics. Want to empower residents? Capture their stories. Mixed-methods mapping works best when your data types match the audience you’re trying to reach.
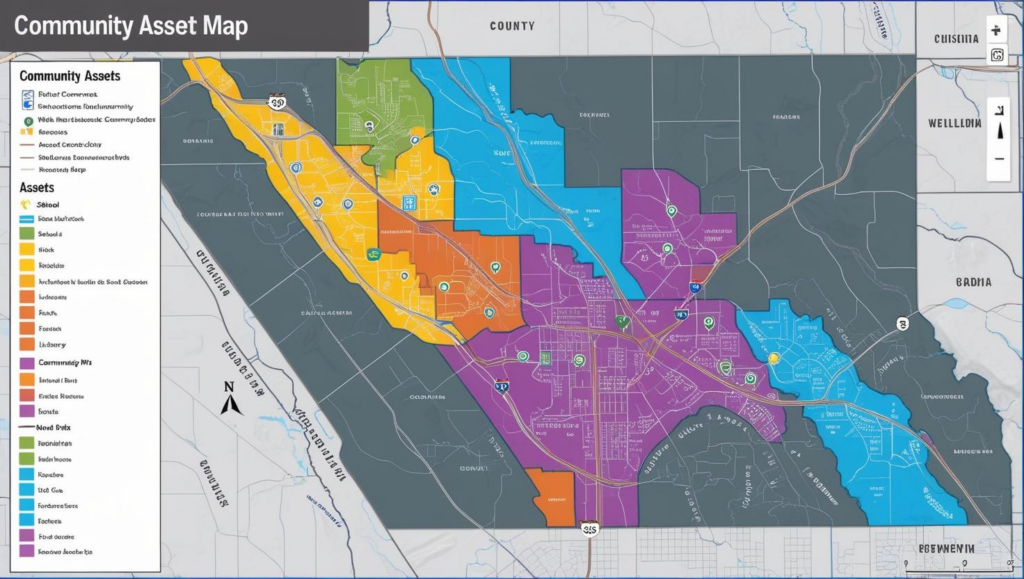
4. GIS-Based Spatial Mapping
This geospatial approach maps assets using Geographic Information Systems (GIS) and is often used to visualize the distribution of physical assets, demographic trends, or resource gaps. Can be layered with relational or participatory data for deeper insight.
🟢 Strengths:
- Powerful visual tool for advocacy and planning
- Enables data layering (e.g., race, income, health outcomes)
- Easy to compare across regions
🔴 Watch-outs:
- Can overlook non-physical or informal assets
- Requires technical expertise or platforms
- Risk of presenting static maps as “final truths”
💡 Pro Tip: Don’t stop at the map—ask why!
GIS will show you where gaps or clusters exist—but community engagement reveals why they exist. Pair spatial analysis with lived community member experiences for deeper, more actionable insights.

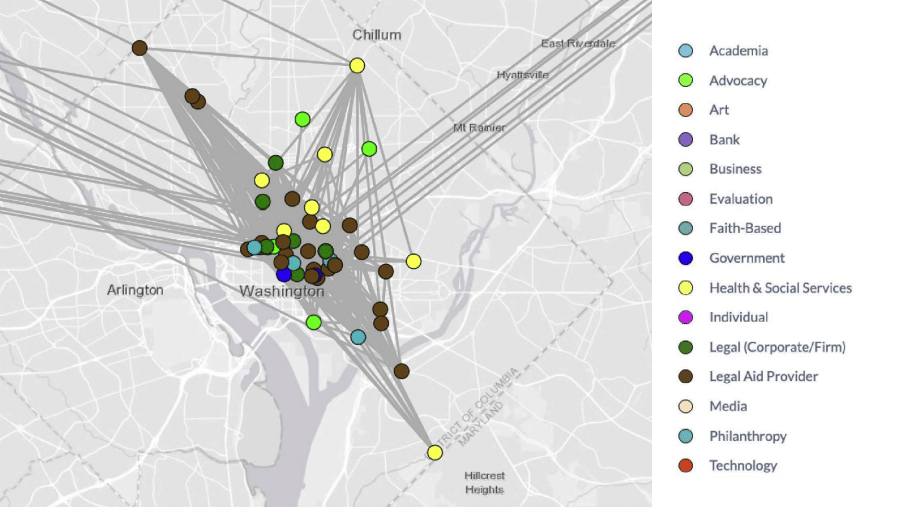
5. Relational Network Mapping (SNA)
This approach uses Social Network Analysis (SNA) to map relationships among individuals or organizations. Rather than just listing assets, it shows how those assets interact: who collaborates, who’s isolated, where trust and influence lie. VNL’s PARTNER CPRM is purpose-built for this.
🟢 Strengths:
- Reveals system dynamics and collaboration patterns
- Quantifies trust, value, and information flow
- Identifies key players, structural gaps
🔴 Watch-outs:
- Requires intentional survey design
- Can be harder for lay audiences to interpret without support
- Needs recurring data collection to track change over time
💡 Pro Tip: Mapping relationships and perceptions!
It’s not just who’s working together—it’s how they feel about those relationships. Use trust and value metrics to uncover blind spots and build stronger, more aligned networks.
Examples of Community Asset Maps
Here are examples of real-world community asset maps in six different formats.
- Google Map – Androscoggin Place Matters: Community Assets
- System Map – Jeffco CPRM Community Partnership Database
- Handwritten Map – Open Learning Library, Massachusetts Institute of Technology
- Geographic/GIS Map – Online Tutorial – ArcGIS
- Participatory Map – Participatory Asset Mapping Toolkit – Community Research Lab
- Report-Style Map – MO Behavioral Health System Asset Mapping Project
Case Studies
Here are additional reviews and case studies with more in-depth examples.
- Review: Community Asset Mapping in Public Health – Applications & Approaches
- Case Study: Asset Mapping in Androscoggin County, Maine
- Case Study: Asset Mapping in a Rural Context (Michael Greco, Lily Savage, and Stella Souza)
- Case Study: Challenges and Successes of Implementing Community Asset Mapping – Philadelphia District Attorney’s Office
Get our monthly newsletter with resources for cross-sector collaboration, VNL recommended reading, and upcoming opportunities for engaged in the “network way of working.”
Beyond Physical Assets: Why Relationships Matter
Many asset maps only capture tangible resources. But increasingly, organizations are realizing that social capital—the relationships and trust between people and institutions—is a real driver of change. Just consider:
- A trusted community leader can reach more people than a public billboard.
- A nonprofit with high mission alignment but low trust won’t be an effective partner.
- An overlooked community group might have deep influence and should be at the table.
Mapping community networks and relationships helps identify unique insights and leverage points for systems change and innovation. This is where tools like social network analysis become essential.
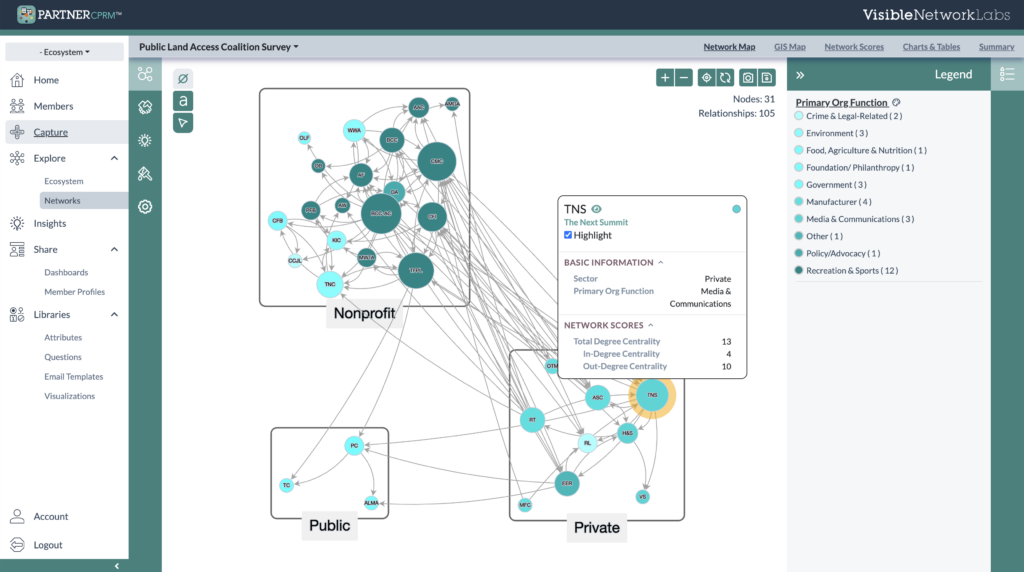
PARTNER CPRM: SNA Platform for Community Asset Mapping
Traditional asset maps fall short when it comes to understanding relationships. That’s why VNL created PARTNER CPRM—a digital platform designed to help coalitions and communities map, measure, and manage their networks.
The PARTNER Platform blends asset mapping with social network analysis (SNA) and GIS mapping technology. It helps public sector and nonprofit leaders:
- Map physical and relational community assets
- Track metrics like trust, power, mission alignment, and collaboration
- Visualize how organizations and people are connected
- Identify key players, central hubs, and disconnected groups
- Optimize resource sharing and improve cross-sector partnerships
- Overlay networks & GIS data for place-based relational insights
Whether you’re working at the neighborhood, county, or statewide level, PARTNER CPRM provides a data-driven way to map, measure, and manage your community networks.

Is Community Asset Mapping Right for You?
You should consider asset mapping if you are:
- A coalition leader needing to understand your ecosystem
- A nonprofit looking to build partnerships
- A grant writer wanting to showcase community readiness
- A funder trying to assess community capacity
- A policy advocate building a case for systems change
In short: if you believe in starting with strengths and building from within, asset mapping belongs in your toolkit.
📌 Frequently Asked Questions (FAQ)
Here are answers to some common questions about community asset mapping. You can also leave questions in the comments and we will respond with more information as soon as possible.
Q: What is community asset mapping?
A: Community asset mapping is a strengths-based process for identifying the resources, relationships, and capacities that already exist within a community. Rather than focusing on what’s missing or broken, asset mapping highlights what’s working—whether that’s individuals with lived experience, organizations providing key services, or networks of collaboration and trust.
Q: What is the ABCD model of asset-based community development?
A: Asset-Based Community Development (ABCD) is a community organizing and development framework that emphasizes starting with what a community has, not what it lacks. Developed by John McKnight and John Kretzmann, the ABCD model encourages leaders to:
- Recognize people as the primary asset of any community
- Focus on strengths and capacities, rather than needs or problems
- Foster community ownership of solutions
- Mobilize local resources and relationships before seeking external help
ABCD is often the foundation for community asset mapping efforts, especially when the goal is equity, empowerment, and sustainability.
Q: What does an asset map look like?
A: It can be a spreadsheet, hand-drawn diagram, or digital network map. The format depends on your goals and tools. PARTNER CPRM generates interactive network maps that are especially useful for tracking relational data.
Q: What’s the difference between asset mapping and needs assessment?
A: Needs assessments look at what’s lacking. Asset mapping focuses on what’s already present and how it can be used to address needs.
Q: How do you identify community assets?
A: Community assets are identified through a combination of community engagement and structured data collection. Common methods include:
- Community workshops or mapping events where residents identify assets on maps or templates
- Surveys or interviews to uncover individual skills, relationships, or under-the-radar organizations
- Community walks to document physical spaces, organizations, or cultural landmarks
- Stakeholder input from trusted partners, coalitions, or networks
Tools like PARTNER CPRM can help collect and visualize this information, including both physical assets (like buildings and funding) and relational assets (like trust, influence, or collaboration among partners).
Q: What is an example of a community asset?
A: A community asset can be any person, place, resource, or relationship that contributes to the well-being of the community. Examples include:
- A community health clinic offering free services
- A local artist who mentors youth
- A neighborhood food pantry
- A parent-teacher association organizing school events
- A faith-based group offering counseling and support
- A nonprofit coalition working on housing policy
- Strong relationships of trust between organizations working on public health
In short, if it helps strengthen the community, improve lives, or bring people together—it’s a community asset.
Q: How long does asset mapping take?
A: It depends on the scope. A small participatory workshop may take 2–3 hours. A full relational asset map using surveys and data analysis may take several weeks or months.
Q: Can I do asset mapping without software?
A: Yes. Many communities start with paper maps and sticky notes. However, software platforms like PARTNER CPRM allow for deeper analysis and long-term tracking.
Q: Is this the same as GIS mapping?
A: GIS maps focus on physical locations. Asset mapping includes GIS but can go further by including social and relational dimensions.
Q: How do I get started with community asset mapping?
A: Start by defining your community and your goals. Engage key stakeholders and choose a mapping method that fits your scale and capacity. Need help? Reach out to our team at Visible Network Labs.