NEW: GIS Network Map Integration
People have been asking us since we first created PARTNER for GIS mapping functionality. Today, we’re proud to share that you can map your networks geographically as a new feature of the Platform. Here’s how to access and try out the new functionality using our sandbox practice data. If you collected addresses about the members of your network during your projects, you can also map your own past networks!
First, login to PARTNER and open a project to analyze.
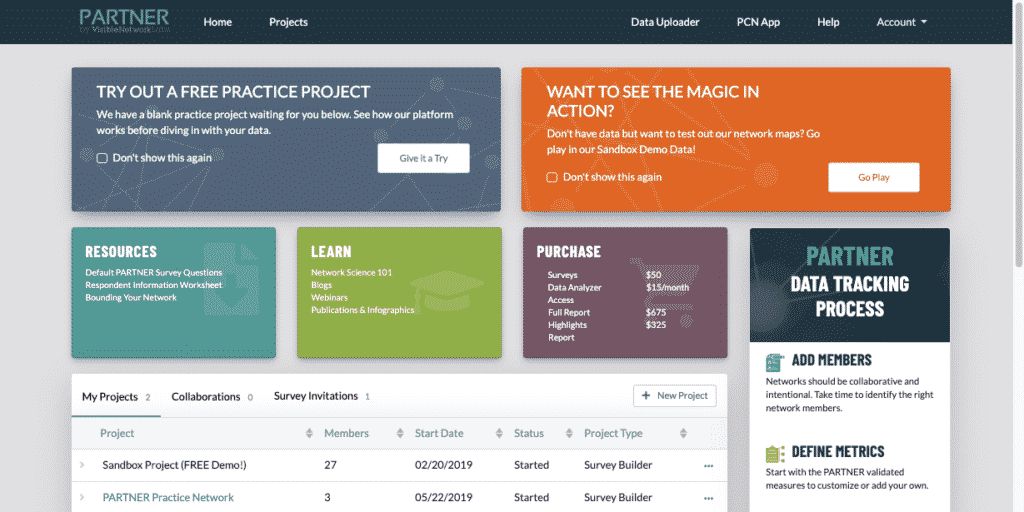
Visit partner.visiblenetworklabs.com to login. If you don’t already have an account, you can register for free (it only takes 30 seconds!). This will take you to the PARTNER Homepage. If you’re a new user, find the orange box on the right and click “Go Play.” Follow the series of directions to open up our Sandbox Dataset. If you have projects you want to geographically map, scroll down to open them in Project Analysis page.
Second, click 'GIS Map' on the top option bar.
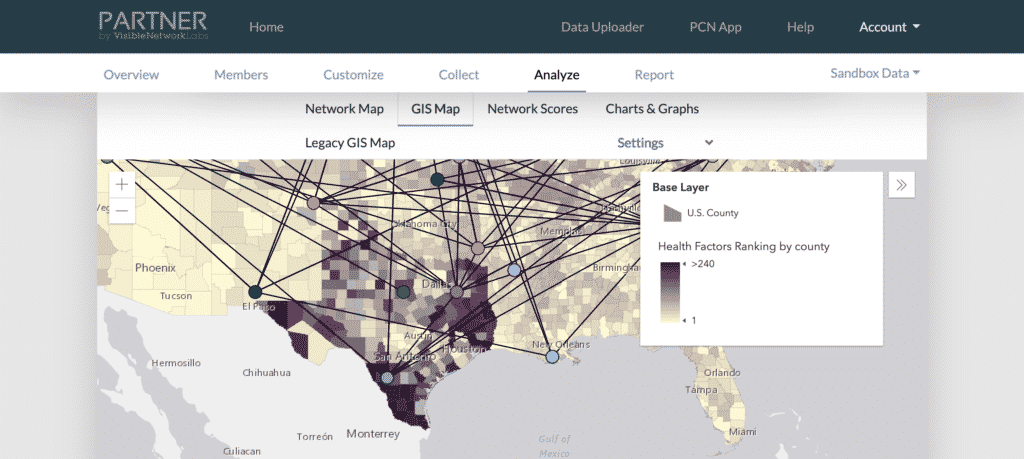
Scroll down on your Project Analysis page to find your map and graph options. The default selection is network map. If you’d prefer, you can setup your network map here first without the GIS layer. Otherwise you can add the geographic map first.
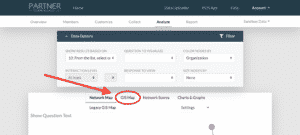
On the right, click “GIS Map” to start mapping your data geographically.
Third, add different layers and mapping options.
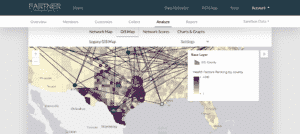
Start by selecting the question you want to be mapped. For a simple map showing your entire network, select question 10. However you can map any of the network question. You can also select base layers to display underneath your network, like county health scores. We’re adding new base layers all the time. The GIS option is a fun new way to visualize your network and demonstrate the geographic breadth of your partnerships and connections.