Reveal Hidden Influence:
Map, Measure & Leverage Your Network with Network Analysis (SNA/ONA)
Uncover real insights—who matters, who’s isolated, and where your relational power lies—with the PARTNER CPRM Platform.
The Problem:
Blind Spots in Your Network
Most organizations work hard at partnerships—but few know what’s really happening underneath the surface.
Who are the actual connectors, gatekeepers, or invisible influencers?
Where are the weak links or siloed relationships pulling your system apart?
Without a data-driven view, these relationship gaps go overlooked—until they derail outcomes.

The Solution:
Data-Driven Network Analysis
- Visualize Your Ecosystem
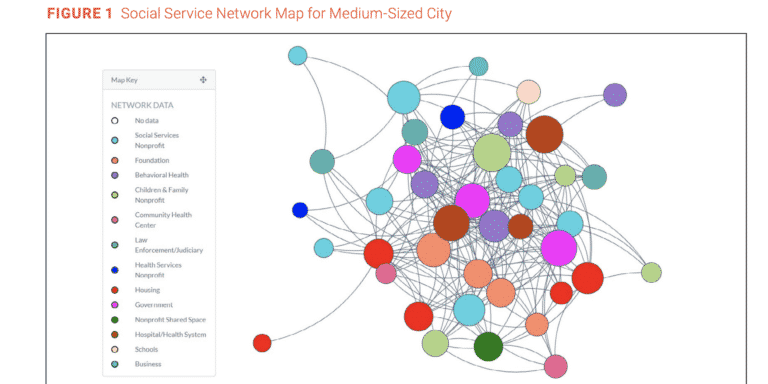
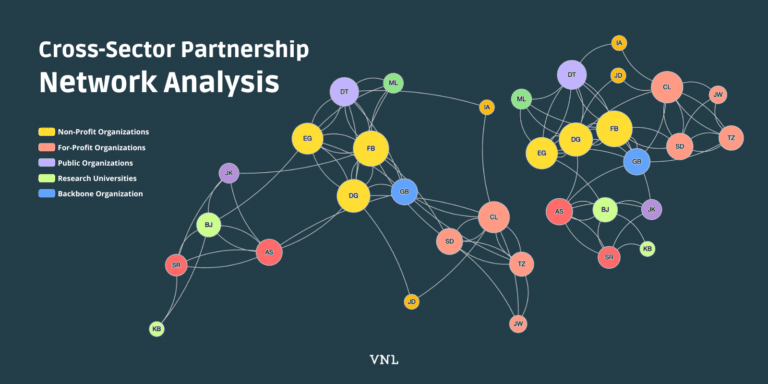
Pinpoint central hubs, isolated actors, and multiple types of key players.
- Measure Relationship Quality
Quantify trust, information flow, and collaboration frequency, not just ties.
- Identify Key Players
Identify critical bridge nodes that help accelerate impact.
- Inform Network Strategy
Optimize outreach, distribute resources, and strengthen resilience.
How It Works

1. Upload a network member data spreadsheet
Start by uploading your existing contacts or partner list into PARTNER CPRM. Each individual, organization, or stakeholder becomes a node in your social network analysis, setting the foundation for mapping relationships.
This step ensures that every connection is captured and ready for analysis, whether you’re looking at a small team or a large cross-sector coalition.

2. Collect network data with a survey
Go beyond names and roles by gathering relational data with a built-in network survey. Collect insights about trust, collaboration frequency, resource exchange, and perceived value between members.
These survey responses feed directly into your social network analysis, providing the evidence needed to understand how your network really functions.
3. Analyze the data to identify insights
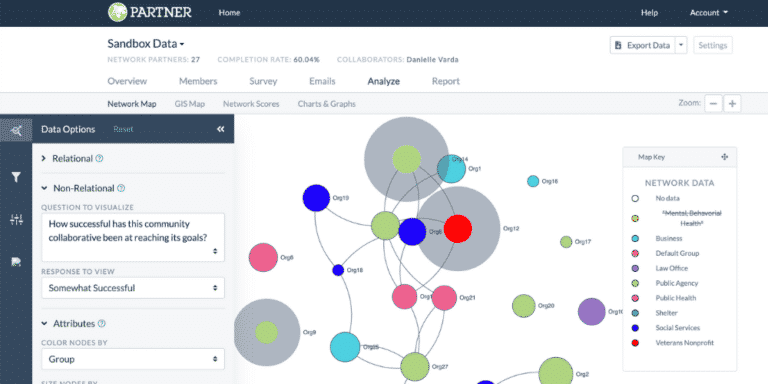
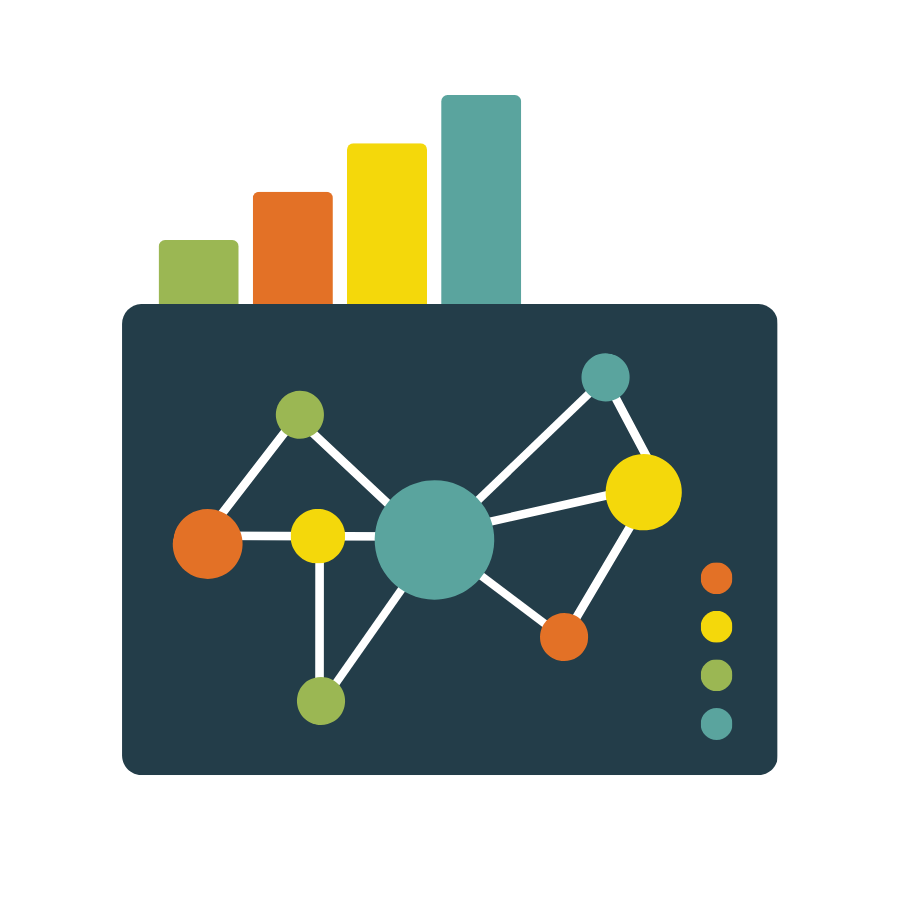
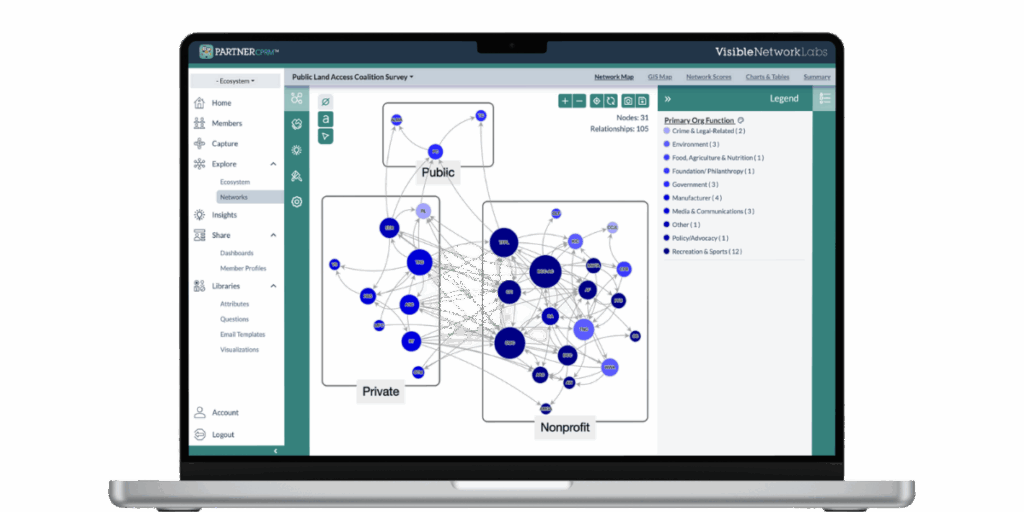
With your data in place, PARTNER CPRM automatically generates network maps and key metrics that reveal hidden patterns. Visualize clusters, central connectors, and structural gaps while calculating measures like centrality and density.
These analyses transform raw data into actionable insights, showing how relationships influence outcomes across your ecosystem.
4. Share findings with interactive dashboards
Turn analysis into action by sharing interactive network maps and dashboards with your team, partners, or funders. Export visuals that highlight collaboration strengths, blind spots, and opportunities for improvement.
By making social network analysis results easy to interpret, you help stakeholders make informed decisions and strengthen collective impact.
Hear from our partners:

Ready to see your network like never before?
With PARTNER CPRM, you have the tools to analyze your network like never before. Request a demo and let us help you discover new opportunities in your community, network, or ecosystem.
What is Social Network Analysis (SNA)?
Social Network Analysis (SNA) and Organizational Network Analysis (ONA) are methods for studying the structure of relationships among people, organizations, or groups. Rather than focusing only on individual attributes, network analysis looks at the connections—or ties—between actors (called nodes). These connections might represent communication, trust, collaboration, information sharing, or the flow of resources. By mapping and measuring these relationships, SNA and ONA help us understand how networks actually function, where they thrive, and where they break down.
At its core, social network analysis answers questions like:
Who is most central in this network?
Which people or organizations act as bridges between groups?
Where are clusters forming, and where are there gaps?
How efficiently does information travel across the network?
Key Concepts in Network Analysis
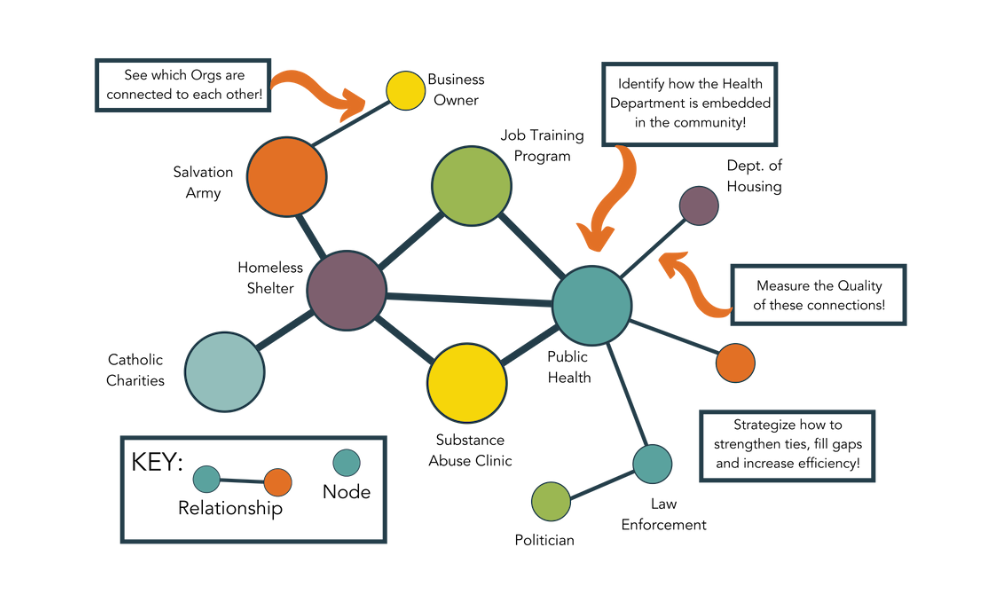
Nodes and Ties: Nodes represent the people or organizations, and ties represent the relationships between them. Together, they form the backbone of a network map.
Centrality: A measure of influence or importance. A node with high centrality is well connected and often plays a key role in spreading information or resources.
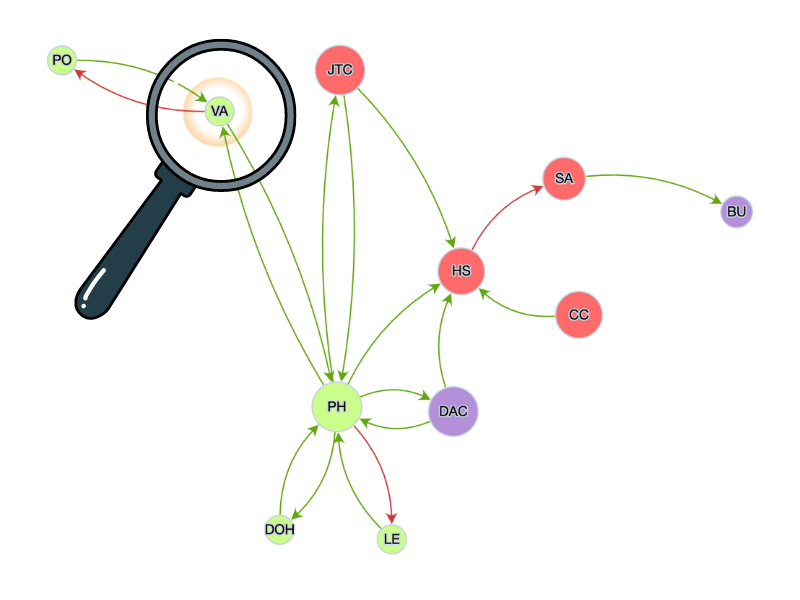
Betweenness: Some nodes act as brokers, bridging otherwise disconnected groups. These “in-between” positions are critical because they control access to information and can accelerate—or block—collaboration.
Closeness: This metric captures how quickly a node can reach all other nodes in the network. A person or organization with high closeness is well positioned to disseminate information efficiently.
Clusters: These naturally form where nodes are more tightly connected. Understanding clusters reveals where collaboration is strong and where silos may be forming.
Why Network Analysis Matters
SNA and ONA are powerful because they make the invisible visible. Relationships drive outcomes in every sector—whether in public health, philanthropy, business, or community coalitions—but without data, those patterns are hard to see. Network analysis provides evidence that can be used to strengthen collaboration, improve equity in participation, and demonstrate collective impact to funders and stakeholders.
Making SNA Easy with PARTNER CPRM
Traditionally, social network analysis required specialized training and complex software. Researchers could leverage tools like Gephi or UCINET, but practitioners often found them too technical or time-consuming. PARTNER CPRM changes that by bringing SNA and ONA into an easy-to-use relationship management platform.
Practitioners can upload contacts, run surveys, and instantly generate interactive network maps.
Researchers can access validated trust and value metrics that add depth beyond structure alone.
Teams and coalitions can share dashboards and insights, ensuring the findings are actionable, not just academic.
By combining the rigor of network science with practical tools for relationship management, PARTNER CPRM makes social and organizational network analysis both accessible and impactful—whether you’re evaluating a grant-funded program, managing a collaborative initiative, or conducting academic research.
Frequently Asked Questions
Q: What is the difference between Social Network Analysis (SNA) and Organizational Network Analysis (ONA)?
A: Social Network Analysis (SNA) focuses broadly on the relationships between individuals, groups, or organizations. Organizational Network Analysis (ONA) is a specific application that looks at how relationships function inside or between organizations—helping leaders understand communication patterns, collaboration, and influence in a workplace or system. Both approaches use the same principles of nodes, ties, and network metrics.
Q: What are the benefits of using social network analysis?
A: SNA provides evidence about how networks actually function. Instead of relying on assumptions, you can see who is connected, who is isolated, and where trust or resource flow is strongest. Benefits include identifying hidden influencers, reducing silos, improving information flow, and demonstrating the value of collaboration to stakeholders and funders.
Q: What kinds of data are needed to run a network analysis?
A: Typically, you need two types of data: a list of nodes (individuals, organizations, or teams) and relational data about how those nodes are connected. Relational data can come from surveys (e.g., “How often do you collaborate with this partner?”) or from administrative records like email logs, meeting attendance, or project data.
Q: What are some key metrics used in SNA and ONA?
A: Common measures include:
Degree centrality: how many direct connections a node has.
Betweenness: whether a node acts as a bridge between groups.
Closeness: how quickly a node can reach others in the network.
Density: the overall level of connectedness in a network.
Clusters: subgroups or communities that are more tightly linked.
These metrics provide a deeper understanding of how a network is structured and where improvements are needed.
Q: Do I need advanced training to use network analysis?
A: Not anymore. While network analysis has its roots in academic research, tools like PARTNER CPRM make it accessible to practitioners, nonprofits, foundations, and government agencies. You can upload contacts, run surveys, and automatically generate maps and metrics without needing coding or specialized software.
Q: How can I share network analysis results with others?
A: With PARTNER CPRM, you can create interactive dashboards and visualizations that highlight key findings. This makes it easy to share insights with team members, funders, or community partners in a way that is clear, engaging, and actionable.
Learn More about Network Analysis
Explore our curated collection of blogs, guides, and infographics related to network analysis, including SNA and ONA.
