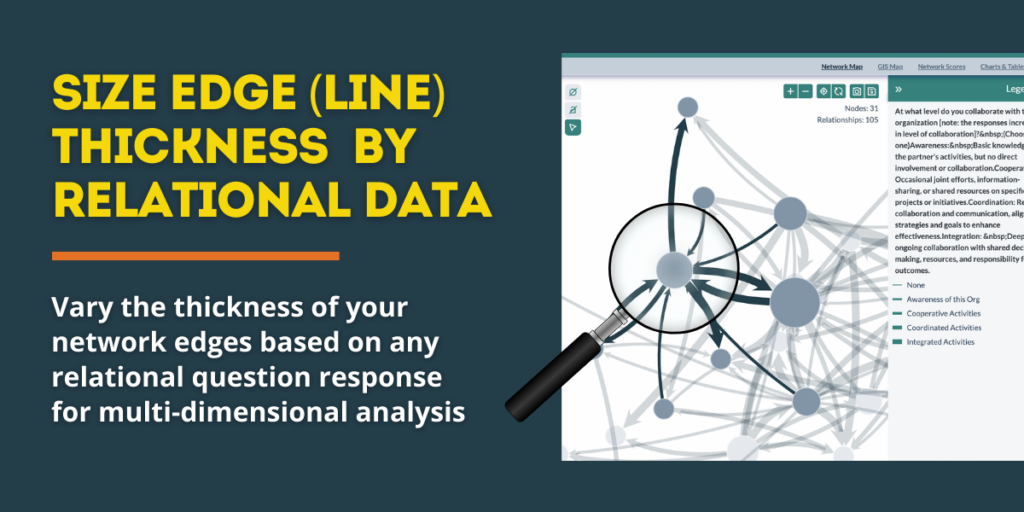
A long-requested feature is here! You can now size network edges (relationship lines) dynamically based on relationship data, giving you a clearer way to visualize the strength and nature of connections within your network.
Here’s everything you need to know about this exciting new PARTNER CPRM™ feature.
What This Feature Does
With this update, you can:
📏 Adjust line thickness based on relationship strength
🔍 Use relationship questions to size edges dynamically
🌐 Identify key connection patterns at a glance
Instead of uniform lines between nodes, you can now thicken or thin relationship edges based on how strong, frequent, or valuable those connections are.
Why This Matters
Seeing relationship strength visually helps you:
✅ Spot key partnerships – Thicker edges show stronger relationships at a glance.
✅ Uncover weak ties – Identify areas where engagement is low.
✅ Analyze relationship distribution – See which connections are most influential.
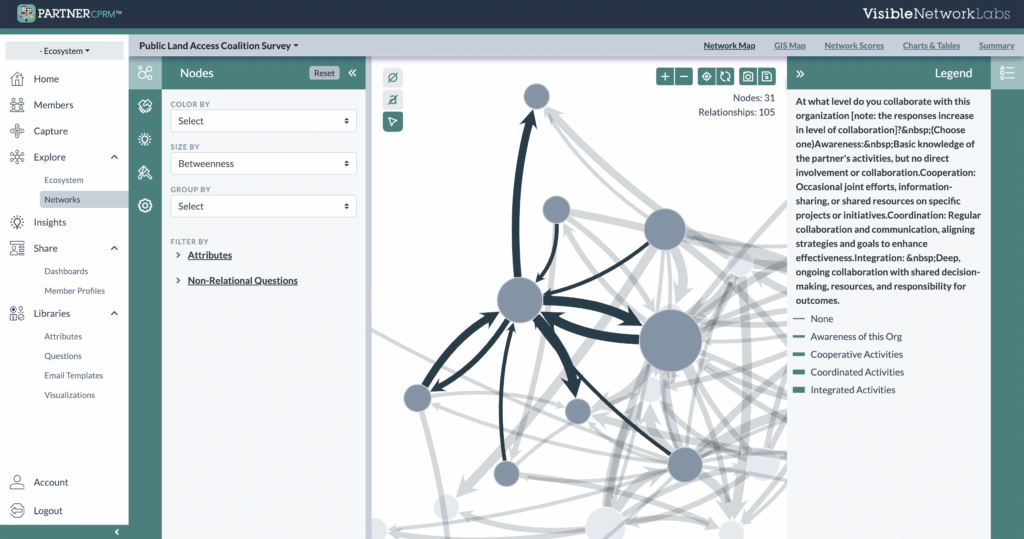
This provides two complementary ways to visualize and explore relationship data in your network maps: line thickness and color choice, with major ramifications for your analysis options.
Edge Sizing is available for both your network maps and GIS maps to create new place-based insights as well.
How to Use It
1️⃣ Open your network in Network Analyzer.
2️⃣ Click “Size Relationships by Data” in the settings panel.
3️⃣ Select a relationship question (e.g., frequency of collaboration) to size edges dynamically.
4️⃣ (Optional) Click “Color Relationships by Data” and select another relationship question to add a second layer of insight.
5️⃣ Watch as edges resize and recolor dynamically based on your data!
🚀 Try it today! Log in to PARTNER CPRM™ and start visually analyzing relationship strength like never before.
Need help? Contact us at support@visiblenetworklabs.com.
More Product Updates
Visit our Platform Updates Page to read all our PARTNER CPRM release notes, featured update articles, and other resources and news so you don’t miss a thing.