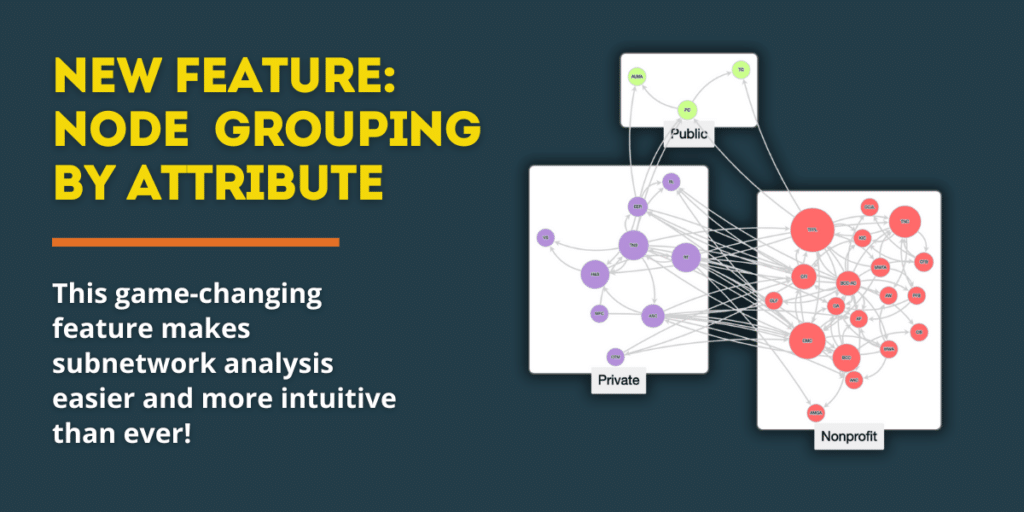
We’re excited to introduce Group Nodes by Attribute, a game-changing feature in the PARTNER CPRM™ Network Analyzer that makes subnetwork analysis more intuitive and actionable than ever before.
For networks both large and small, this feature transforms complex, tangled maps into clear, structured visualizations, allowing you to compare, analyze, and track network connections at a more granular level.
How This Feature Enhances Subnetwork Analysis
By grouping nodes based on a selected attribute—such as sector, geography, program involvement, or funding source—you can:
1. Compare Subnetwork Characteristics
- Assess size, composition, density, and connectivity within each group.
- Identify whether certain groups are more interconnected or isolated.
- Track resource-sharing, collaboration, and power dynamics within subnetworks.
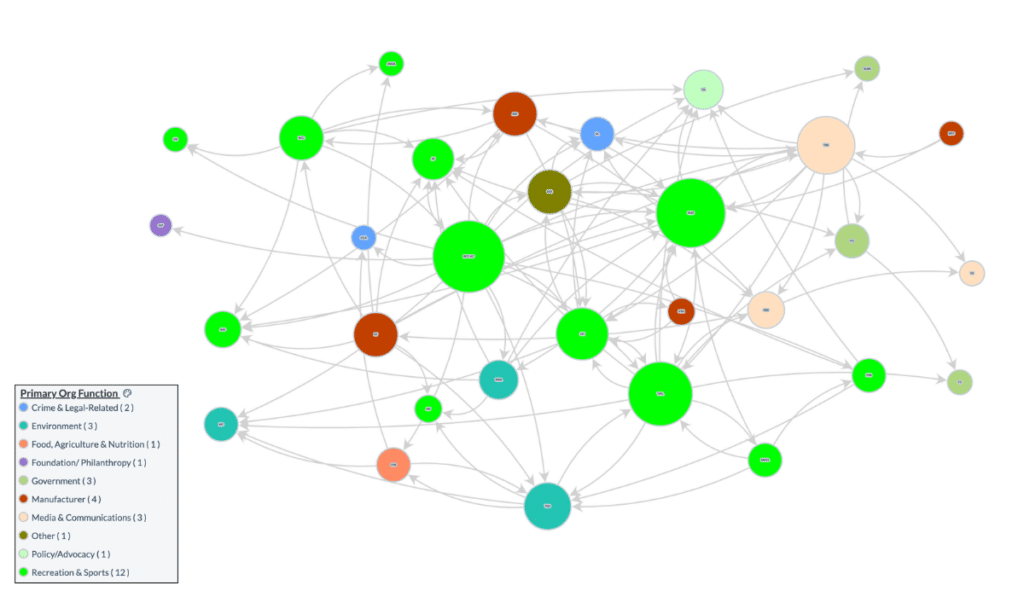
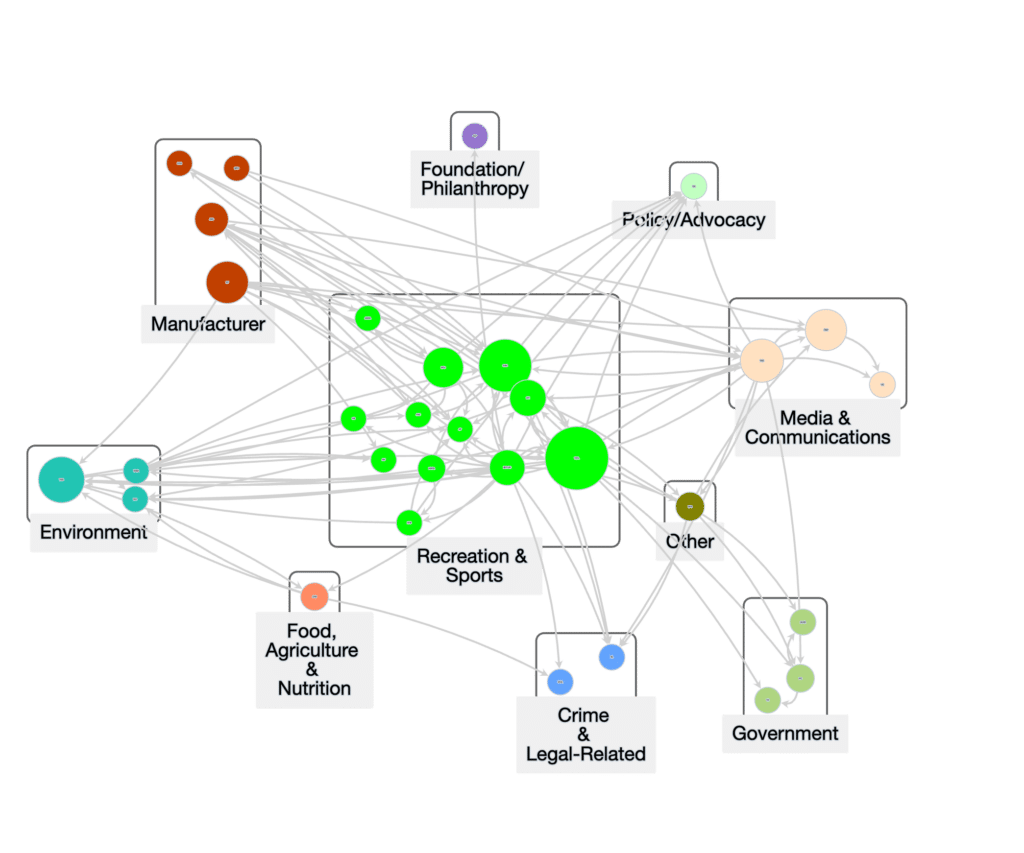
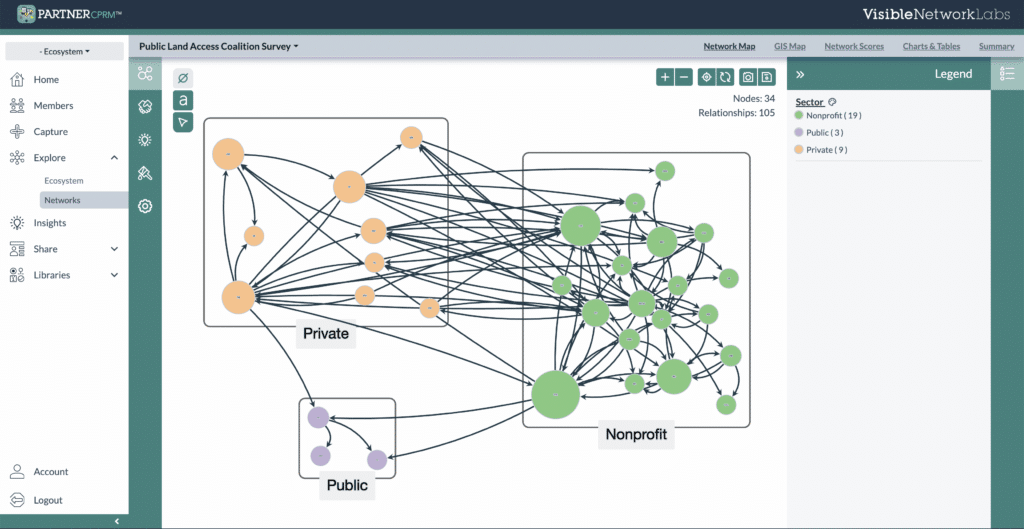
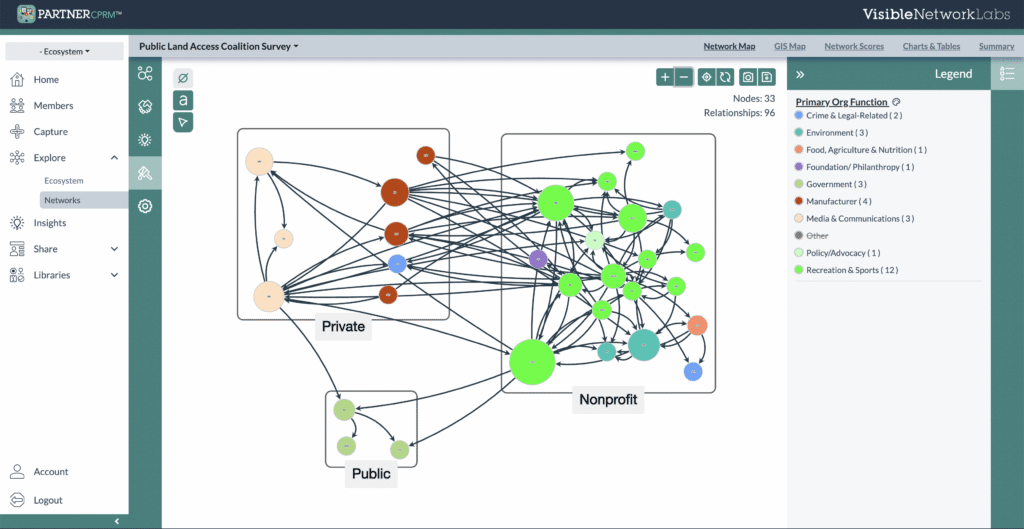
These two PARTNER CPRM™ visualizations show the same network structure of a public lands coalition. As the map on the right demonstrates, grouping the nodes by their focus area makes it much easier to understand how the various subnetworks are embedded withing the broader ecosystem and the key players within each industry.
Both maps, shown together, provide a more nuanced and multi-dimensional understanding of the overall network.
2. Analyze Connections Across Groups
- See how different sectors, regions, or roles interact with one another.
- Identify which groups are most integrated and where silos exist.
- Understand how partnerships form across different types of organizations.
3. Identify Key Players & Brokers
- Pinpoint the most central or influential members within each group.
- Identify boundary-spanning brokers—those who connect otherwise separate groups.
- Analyze leadership dynamics and see who drives collaboration across the ecosystem.
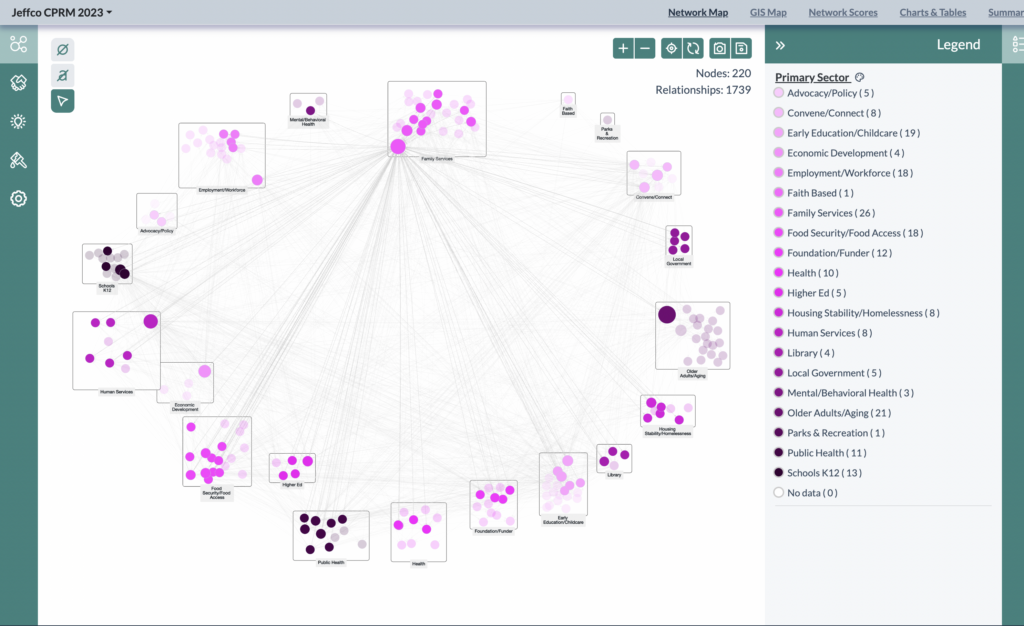
4. Improve Readability for Large & Dense Networks
Many of our users have struggled with overly dense, hard-to-read network maps that resemble entangled rubber band balls—especially in large networks like Jeffco CPRM. Previously, the filter tool helped simplify views, but now you can display the entire network in a more intuitive way, structured similarly to how people and organizations naturally interact—stronger ties within their groups, with key connections across groups.
Advanced Use Cases for Deeper Insights
Here are some advanced use cases to glean more from your network and relationship data.
1. Multi-Layered Analysis: Group by One Attribute, Color by Another
Take your analysis further by grouping nodes by one attribute while coloring them by another.
Example:
- Group by sector (Public, Private, Nonprofit) while coloring by function (Healthcare, Food & Nutrition, Manufacturing).
- Quickly spot trends, such as how manufacturers are primarily private businesses while food and nutrition organizations are mostly nonprofits.
2. Longitudinal Analysis: Track Network Evolution Over Time
This feature is also a powerful tool for longitudinal network tracking.
- By analyzing how subnetworks grow, consolidate, or fragment, you can assess the lifecycle of a sustainable network.
- This can provide insights into whether a network has transitioned from a “More is Better” structure to a more strategic structure that leverages sub-groups and bridge ties.
Best Practices for Leveraging Node Grouping
To maximize the value of this feature, accurate and thoughtful coding of attributes is more important than ever.
✔️ Use single-select attributes (mutually exclusive categories) that accurately reflect the nature of each organization’s work.
🚫 Avoid missing or inaccurate coding, as it will diminish the effectiveness of the grouping feature.
👉🏻 For best results, use the “fCose” layout algorithm while grouping nodes by attribute. The system will default to this automatically but may result in errors if you switch to another algorithm while nodes are still grouped.
Get Started Today!
Ready to unlock powerful new insights in your network? Try out Nodes Grouping by Attribute in the PARTNER CPRM™ Analyzer today!
📩 Have questions or need guidance? Contact us at support@visiblenetworklabs.com.
🚀 Start exploring your networks like never before!