Cross-sector partnerships bring together organizations from government, business, and nonprofit sectors to tackle complex societal challenges. Yet, while collaboration can unlock new resources and ideas, it also presents challenges in coordination, communication, and trust-building. Social Network Analysis (SNA) is a powerful tool for visualizing and measuring the structure of these partnerships, offering data-driven insights to inform strategy and improve collaboration effectiveness.
By mapping relationships among organizations, SNA helps leaders understand who is connected to whom, where gaps or bottlenecks exist, and how to optimize collaboration. This article explores key SNA methods and metrics used in cross-sector partnerships and shares real-world case studies demonstrating how SNA enhances strategy and decision-making.
Table of Contents
How Social Network Analysis Works in Cross-Sector Collaboration
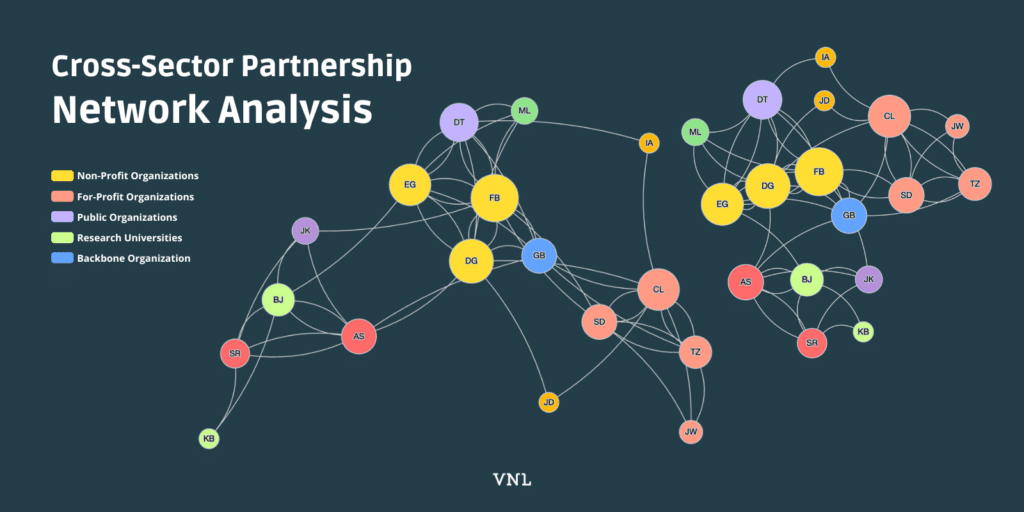
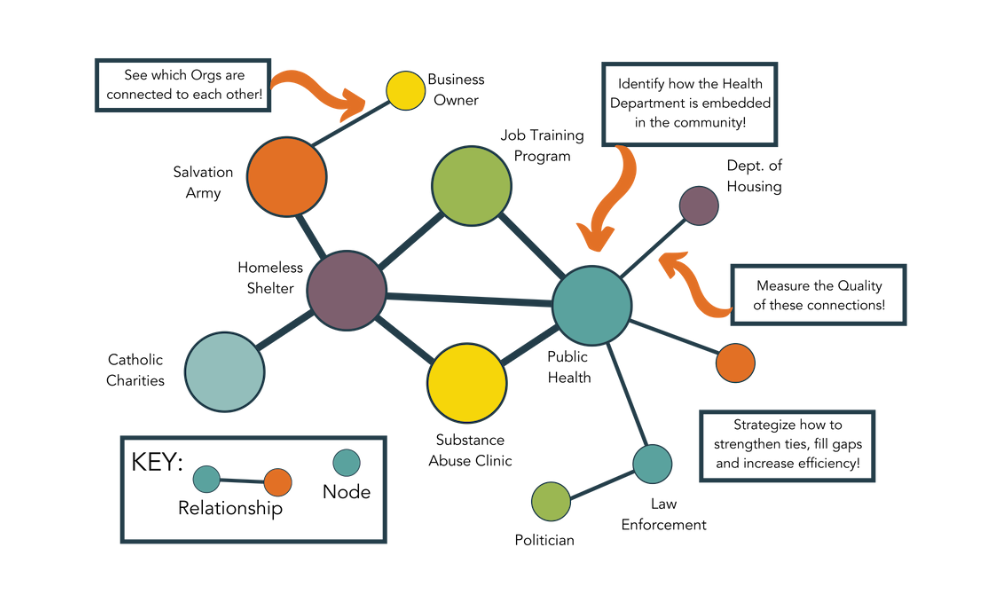
SNA is a method that visualizes partnerships as a network of nodes (organizations) and edges (their relationships). Data for SNA is typically collected via surveys, interviews, or organizational records, capturing collaboration ties such as funding relationships, information sharing, and co-implementation of projects. This network perspective enables leaders to:
- Identify key influencers and brokers within the partnership.
- Uncover silos or weakly connected groups that may need stronger ties.
- Evaluate whether information flows efficiently across all sectors.
- Ensure the structure of collaboration aligns with strategic goals.
Key SNA Metrics and Their Strategic Value
Once a partnership network is mapped, SNA provides quantitative insights into how organizations are connected. Below are critical SNA metrics used in cross-sector partnerships and their strategic implications:
1. Degree Centrality (Connectivity)
What it Measures: The number of direct connections an organization has.
Strategic Insight: High-degree organizations act as communication hubs, making them crucial for information dissemination. If key organizations have low degree centrality, targeted engagement strategies may be needed.
2. Betweenness Centrality (Bridge Influence)
What it Measures: How often an organization lies on the shortest path between others.
Strategic Insight: Organizations with high betweenness centrality serve as bridges between sectors. They should be supported to maintain effective knowledge sharing and prevent bottlenecks.
3. Closeness Centrality (Reachability)
What it Measures: How quickly an organization can reach all others in the network.
Strategic Insight: Partners with high closeness centrality can efficiently spread information. If some organizations have low closeness, it suggests they may be isolated and need stronger integration.
4. Eigenvector Centrality (Influence of Connections)
What it Measures: Whether an organization is connected to highly influential partners.
Strategic Insight: High eigenvector centrality indicates an organization is well-placed within the core of the network and can play a role in amplifying collective efforts.
5. Network Density (Overall Connectivity)
What it Measures: The proportion of all possible connections that actually exist.
Strategic Insight: Low-density networks may indicate fragmentation, requiring efforts to build bridges between disconnected groups.
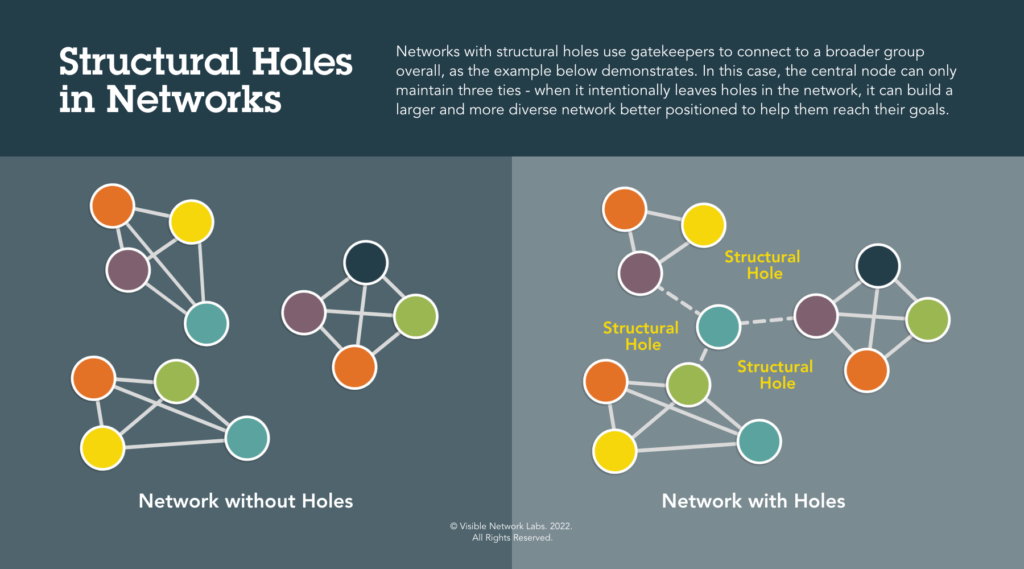
6. Structural Holes and Effective Size (Bridging Diversity)
What it Measures: Whether an organization connects distinct groups that don’t otherwise interact.
Strategic Insight: Organizations filling structural holes act as essential cross-sector brokers and should be empowered with leadership roles.
7. Trust and Value Perceptions
What it Measures: Relationship quality, based on trust and perceived value ratings between partners.
Strategic Insight: Even well-connected partnerships can fail if trust is low. SNA can identify trust gaps and guide interventions like team-building efforts.
Applying SNA Insights to Strengthen Partnerships
SNA enables leaders to move from intuition to data-driven decision-making in managing cross-sector partnerships. Here are key strategies informed by SNA findings:

Get our monthly newsletter with resources for cross-sector collaboration, VNL recommended reading, and upcoming opportunities for engaged in the “network way of working.”
1. Identifying Key Players and Brokers
Organizations with high centrality metrics (degree, betweenness, eigenvector) should be engaged in leadership roles. These partners can serve as information hubs, coalition builders, and knowledge translators between different sectors.
2. Bridging Gaps Between Sectors
SNA often uncovers silos where groups within the network are only internally connected. Strategies such as joint working groups, shared events, and mentorship programs can be used to intentionally bridge these divides.
3. Optimizing Information Flow
If SNA shows that a single partner acts as the sole bridge between groups, backup communication pathways should be established to ensure the network remains resilient even if one organization exits.
4. Strengthening Trust and Value Exchange
When trust and perceived value are uneven across the network, tailored interventions such as conflict resolution training or clarifying roles and expectations can improve collaboration.

5. Monitoring Progress Over Time
SNA is not a one-time analysis but a tool for continuous improvement. By measuring changes in network structure over time, organizations can assess whether their strategies are increasing connectivity, reducing silos, and improving trust.
Case Studies: SNA in Action
Here’s how social network analysis has been used in real-world communities to strengthen cross-sector collaboration among stakeholders and community partners.
1. Global Agricultural Research Network (CGIAR Genebank Platform)
CGIAR used SNA to assess collaboration among agricultural research institutions. The analysis revealed that external partners (e.g., national agricultural research systems) played critical brokerage roles but were underutilized. As a result, CGIAR restructured its collaboration model to strengthen relationships with these key connectors, enhancing knowledge-sharing efficiency. Read more
2. Cross-Sector Health Partnerships in Kentucky
An SNA study of rural and urban health coalitions found that the rural network relied heavily on a single healthcare provider as a hub, while the urban network had a more distributed structure. This insight led the rural coalition to decentralize leadership responsibilities, ensuring more resilience in case of turnover. Read more
3. Community Network for Childhood Trauma Prevention (Colorado)
SNA helped a rural Colorado partnership assess how organizations supported families facing childhood trauma. The analysis showed nonprofits played a backbone role in service delivery, while clinics were central to program coordination. The coalition used these insights to strengthen nonprofit funding and formalize clinics’ leadership roles. Read more

Final Thoughts: Leveraging SNA for Community Partnerhips
Social Network Analysis offers a transformative approach for managing cross-sector partnerships. By mapping collaboration networks and analyzing key structural and relational metrics, organizations can identify strategic priorities, enhance information flow, and build more resilient coalitions. As partnerships evolve, ongoing SNA assessments ensure that collaboration structures align with mission goals, maximizing collective impact.
For organizations looking to strengthen their cross-sector work, integrating SNA into strategic planning provides an evidence-based way to optimize relationships, improve coordination, and drive systemic change. Whether addressing global challenges like food security or local issues like public health, the insights from SNA empower leaders to turn complex partnerships into well-coordinated, high-impact collaborations.
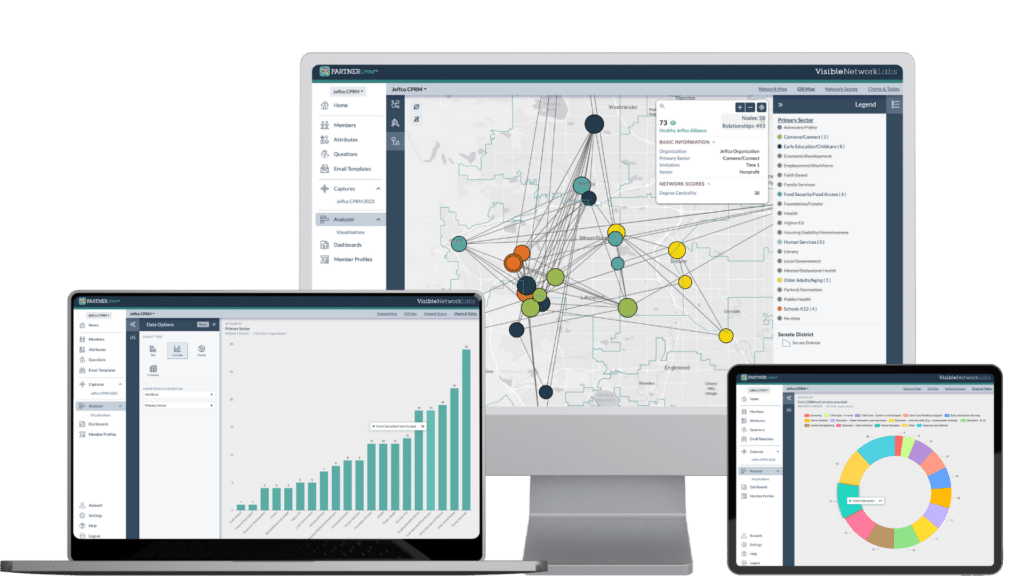
PARTNER CPRM: SNA for Community Partners
To learn more about how Social Network Analysis can enhance your cross-sector partnerships, consider using PARTNER CPRM. Built specifically for mapping and strengthening community partner relationships, it leverage network science tools, methods and metrics to provide data-driven insights. Ready to learn more?
Click here to book your complimentary web demo
Additional Reading
Continue learning with these helpful websites, articles, and other resources.
- Implementation of cross-sector partnerships: a description of implementation factors related to addressing social determinants to reduce racial disparities in adverse birth outcomes
- Social Network Analysis: Evaluation of the CGIAR Genebank Platform
- A case study on variations in network structure and cross‐sector alignment in two local systems serving pregnant and parenting women in recovery
- How to Conduct an Organizational Network Analysis: Step-by-Step Guide – Visible Network Labs
- Evaluating Networks Using PARTNER: A Social Network Data Tracking and Learning Tool
- Data-Driven Management Strategies in Public Health Collaboratives – Journal of Public Health Management & Practice