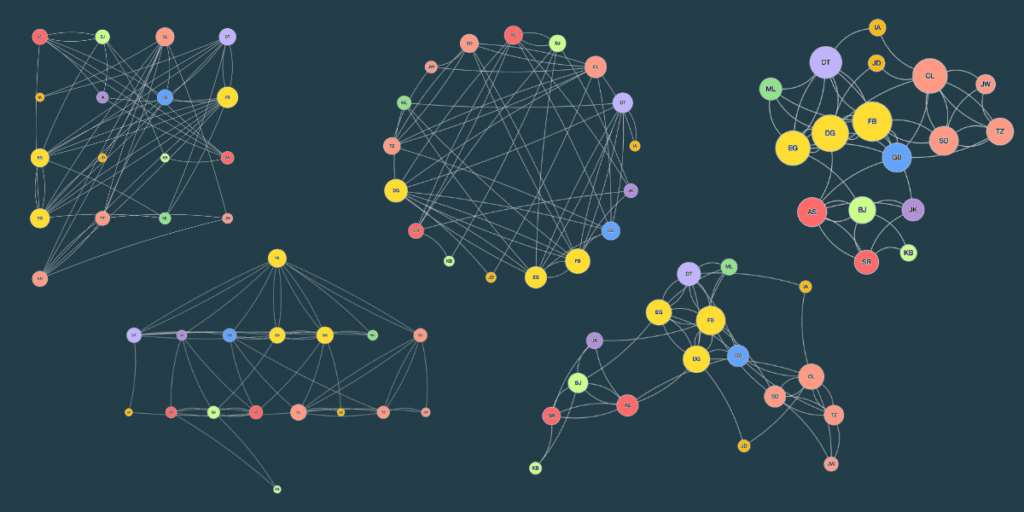
In social network analysis (SNA), visualizing relationships is as important as analyzing them. A well-organized network map can reveal hidden patterns, highlight key connections, and tell a compelling story about your network. But with so many ways to arrange nodes (members) and edges (relationships), how do you decide which layout is best for your goals?
That’s where layout algorithms come in. These algorithms determine how your network map looks, arranging nodes and edges to bring clarity to your data. In PARTNER CPRM, you have access to several layout options, each with unique strengths. Let’s explore these algorithms and help you choose the right one for your network.
Table of Contents
What Are Layout Algorithms?
In social network analysis (SNA), layout algorithms play a critical role in transforming raw data into meaningful visualizations. These algorithms use mathematical and computational principles to position nodes (network members) and edges (relationships) in a way that brings clarity and insight to the network’s structure.
The arrangement of nodes isn’t random—it’s carefully calculated to emphasize key aspects of your network, such as how members are connected or how resources flow through the system.
Why Use Different Layout Algorithms?
The primary goal of a layout algorithm is to make your network map easy to interpret while uncovering patterns and relationships that may not be obvious from raw data alone. A thoughtfully chosen layout can help you identify:
- Clusters of collaboration: Areas where members work closely together or share common objectives.
- Influential members of the network: Individuals or organizations that serve as central connectors, brokers, or hubs of activity.
- Gaps or opportunities for strengthening relationships: Unconnected or weakly connected members who could benefit from more engagement or support.
By visualizing your network with the right algorithm, you can gain actionable insights that guide decision-making, highlight areas for improvement, and showcase the strengths of your partnerships.
6 Layout Algorithms in PARTNER CPRM
Here’s an overview of the available layout algorithms for network visualization in the PARTNER CPRM platform.
1. CoSE (Compound Spring Embedder)
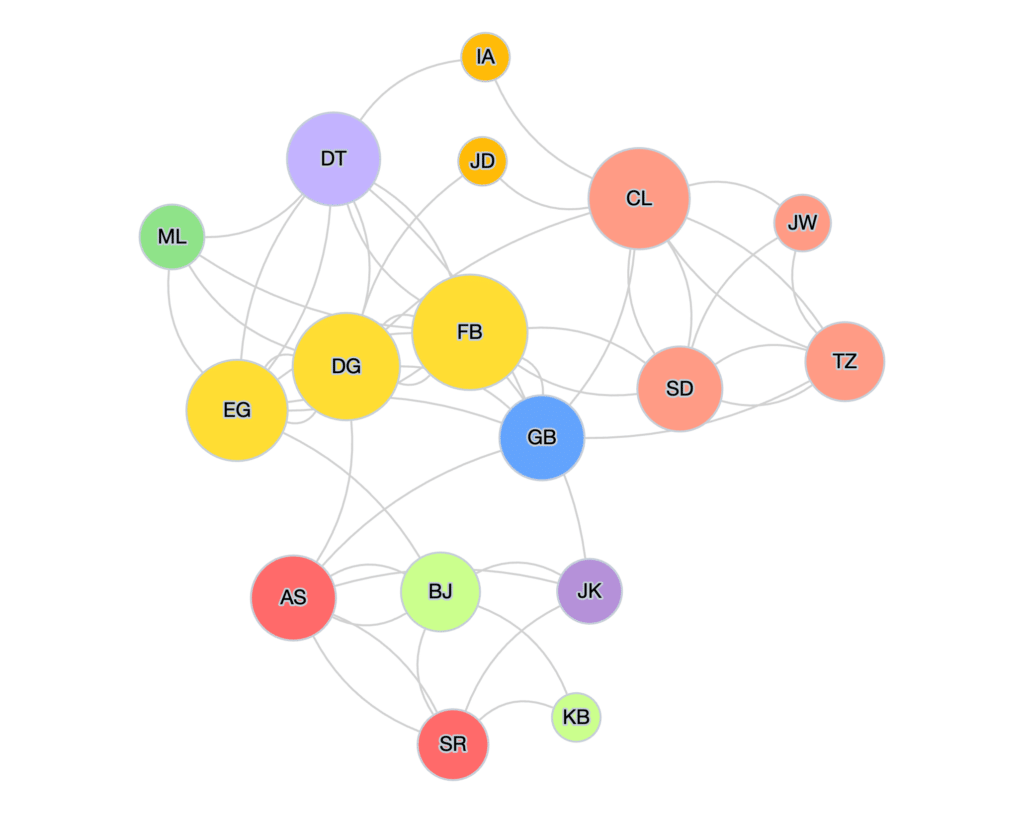
CoSE uses a spring-based model where edges act like springs pulling connected nodes together, while nodes repel each other. This creates a natural, clustered look.
When to Use It:
- You want a balanced and intuitive view of the network.
- You’re presenting the network to a general audience.
Example Use Case:
A community health coalition wants to explore how organizations collaborate on mental health services. Using CoSE, the network map clusters organizations that frequently interact.
The natural spring-like appearance makes it easy to spot tight-knit groups working together and more isolated nodes that might benefit from stronger connections.
2. fCoSE (Fast CoSE)
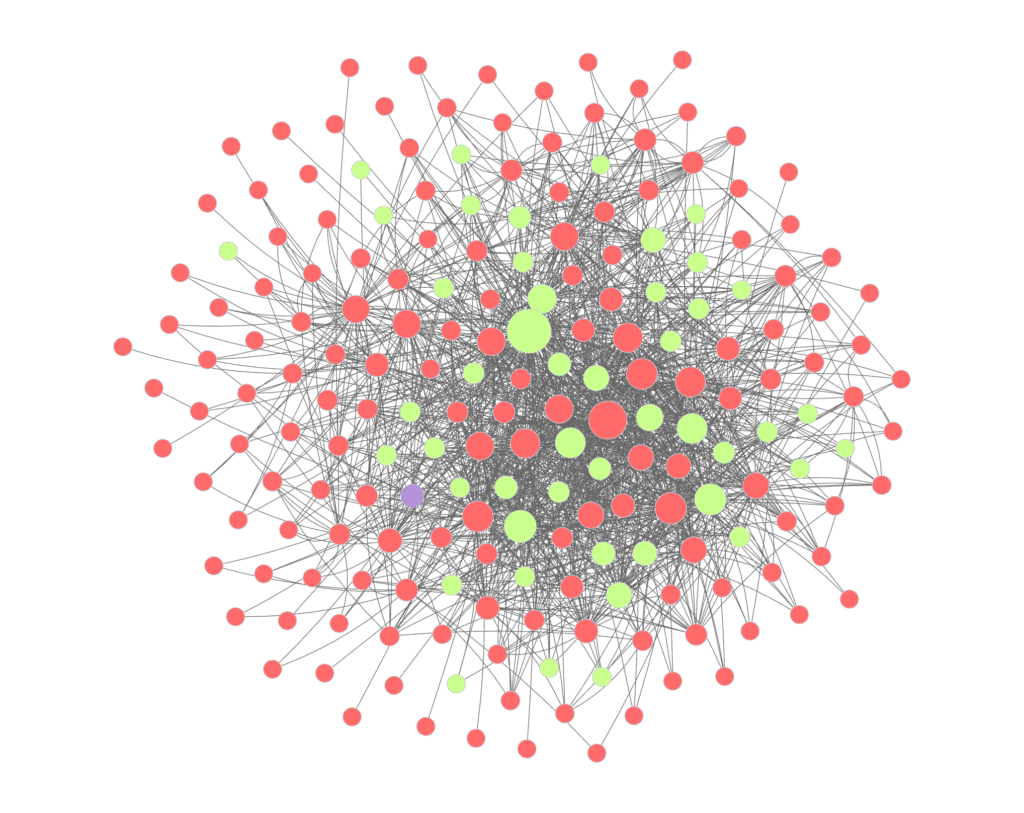
fCoSE is a faster version of CoSE, designed for large networks. It maintains the organic appearance while reducing computation time.
When to Use It:
- Your network has hundreds or thousands of nodes.
- You need quick results but still want a clear, visually appealing map.
Example Use Case:
If the coalition expands to include hundreds of members across the state, fCoSE generates a similar layout as CoSE but faster.
This allows for a quick overview of the larger network while preserving clarity, showing regional clusters working on specific initiatives like substance abuse prevention or chronic disease management.
3. D3-Force
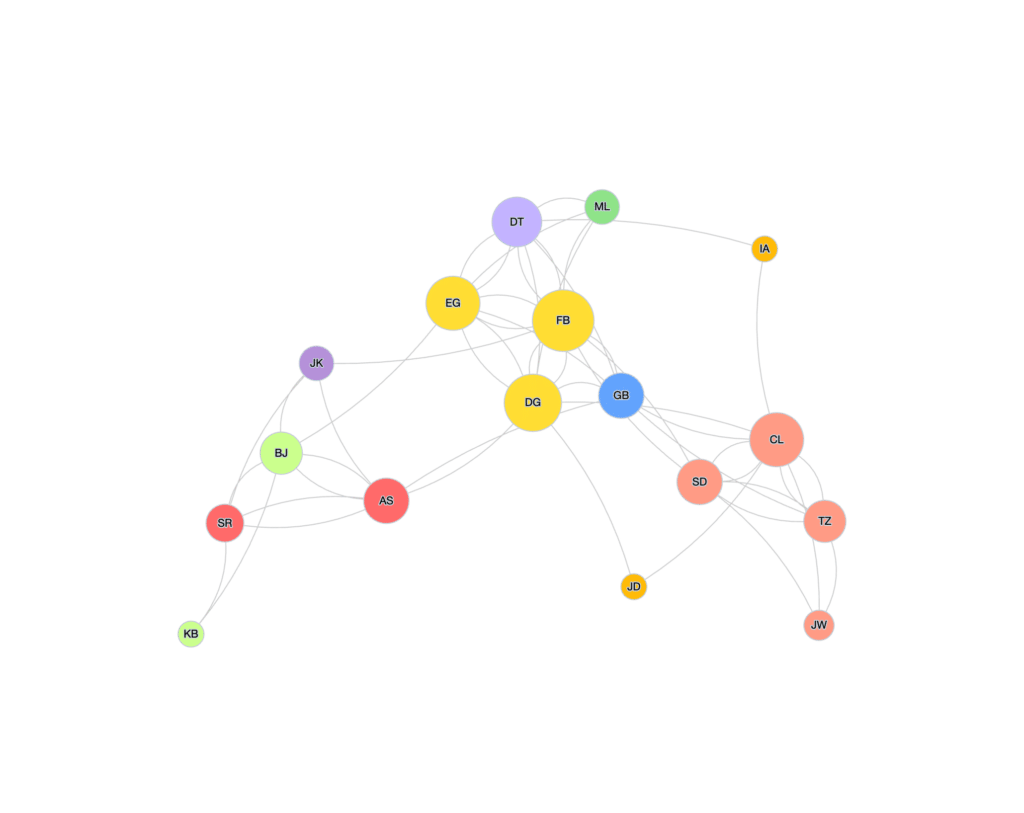
D3-Force is another force-directed algorithm that gives you control over forces like gravity and charge, offering high flexibility for customization.
When to Use It:
- You’re an advanced user with specific visual goals.
- You want to tweak how nodes are positioned to emphasize certain dynamics.
Example Use Case:
The coalition wants to showcase key organizations acting as “bridges” between disconnected groups. By fine-tuning parameters in D3-Force, you can highlight these connecting nodes, showing how their position helps facilitate communication and resource sharing between smaller subgroups.
4. Grid
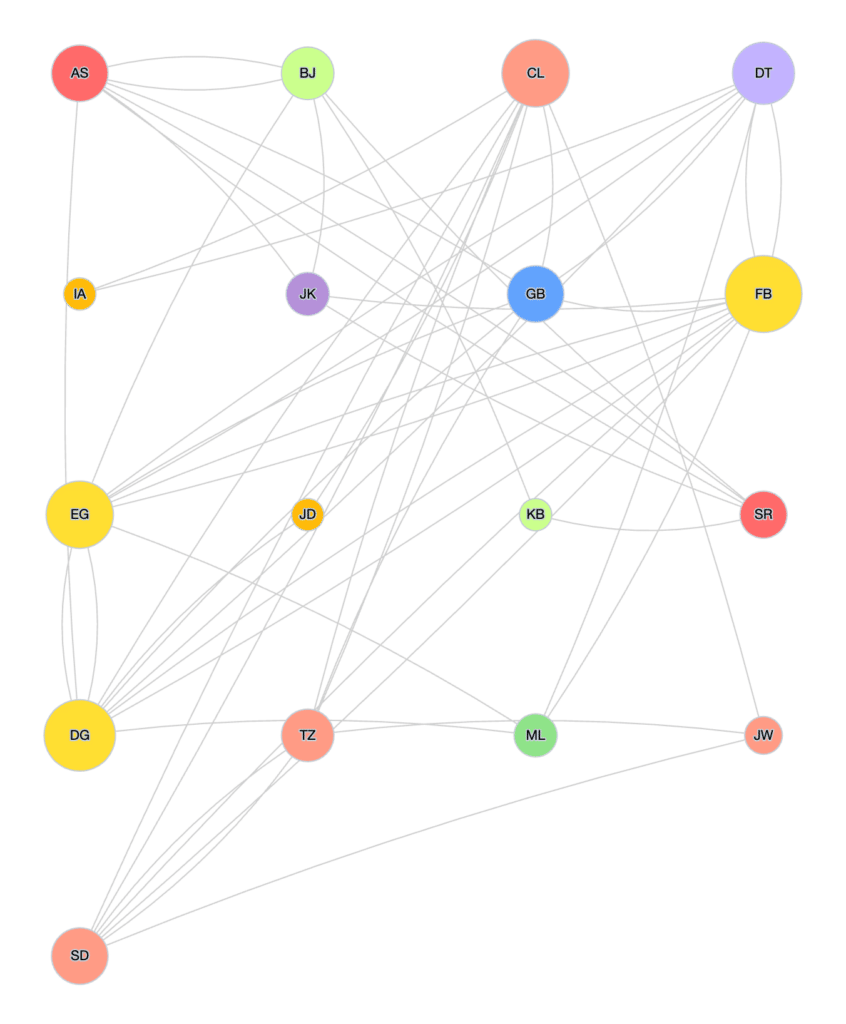
Grid arranges nodes in a regular, orderly pattern without prioritizing relationships, clusters, or other network factors.
When to Use It:
- You’re focusing on attributes (e.g., sector, role) rather than relationships.
- You need a clean, simple layout for comparison across the overall network or ecosystem.
Example Use Case:
The coalition wants to display the sectors represented in the network (e.g., healthcare, education, government) to evaluate diversity. The Grid layout arranges organizations in neat rows and columns, grouping them by sector, making it easy to spot underrepresented groups or over-reliance on one sector.
5. Circle Layout
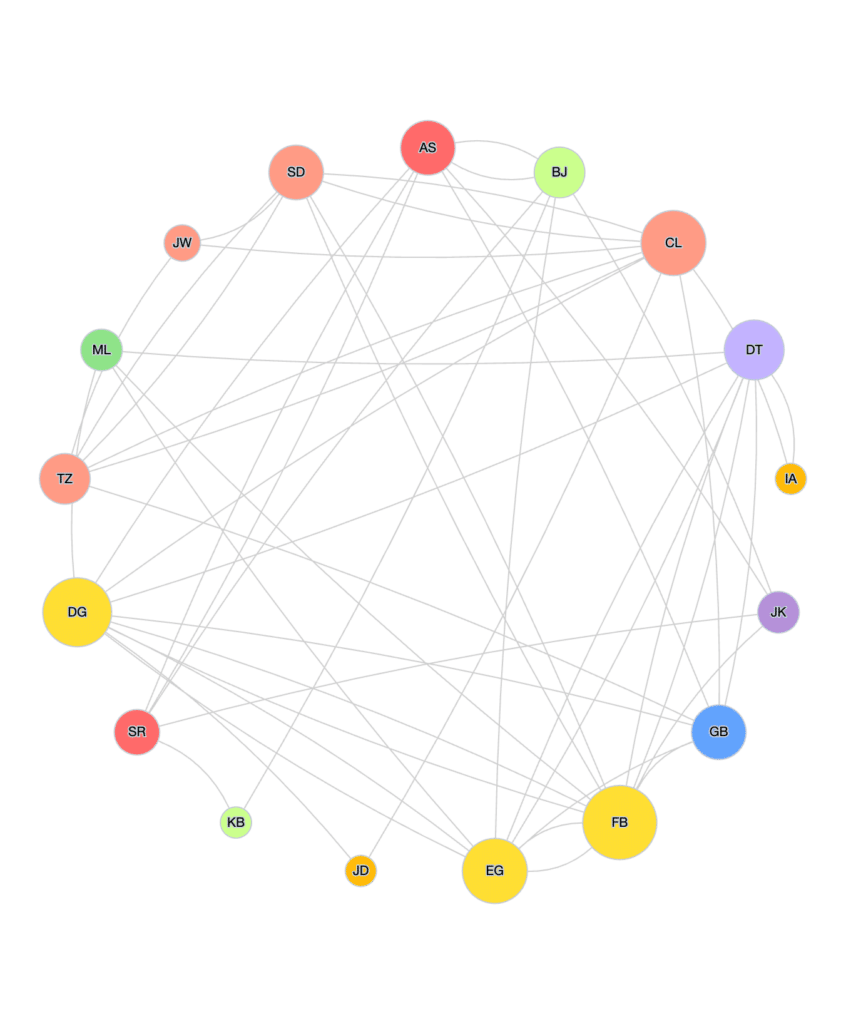
Circle positions nodes in a circular arrangement, treating all nodes equally regardless of relationships.
When to Use It:
- You’re showcasing equality among members.
- You want to highlight specific groups or categories.
Example Use Case:
The coalition wants to showcase the equal importance of all member organizations during a public presentation or group sense-making session.
Using the Circle layout, each organization is positioned equidistantly, reinforcing the idea that every member plays a critical role in achieving the coalition’s goals, rather than assigning some as central and others as peripheral.
6. Breadth-First Layout
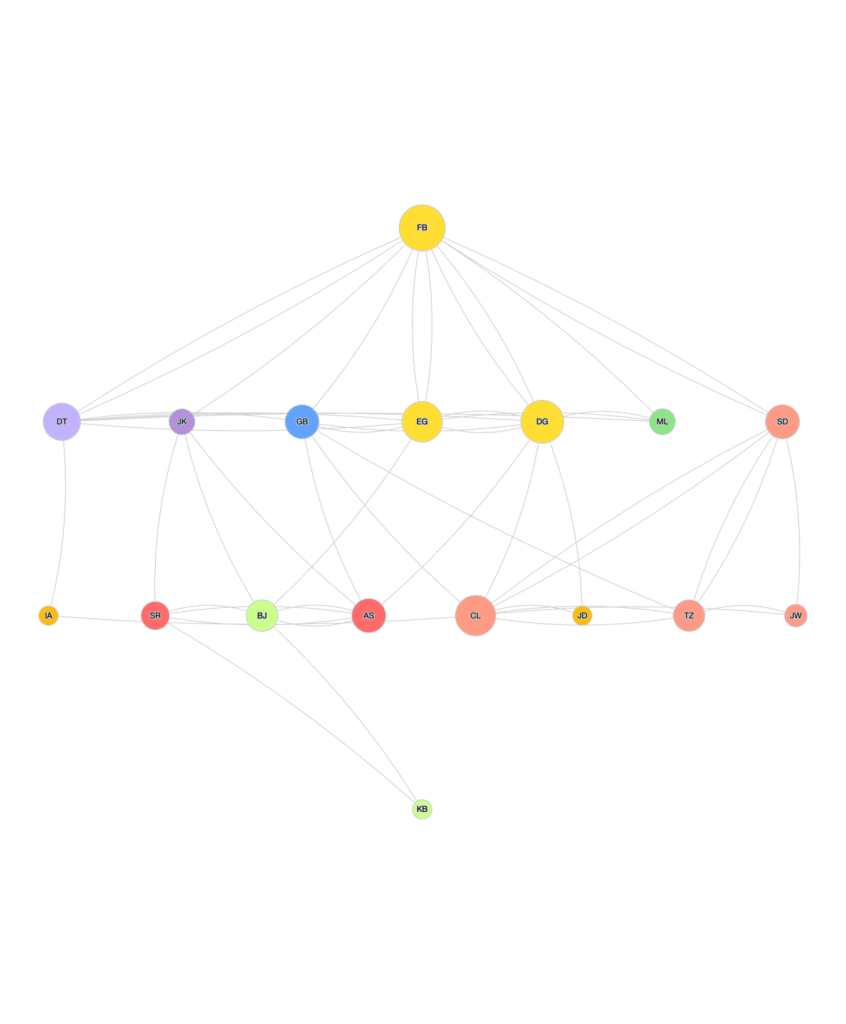
Breadth-First arranges nodes hierarchically, starting from a central node and spreading outward, resembling a tree structure.
When to Use It:
- Your network has a clear hierarchy or flow of influence.
- You want to highlight dependencies or pathways.
Example Use Case:
The coalition wants to show how funding flows from a central government agency to regional hubs and then to local community organizations. Breadth-First organizes the map into hierarchical layers, with the funding agency at the center and each subsequent layer representing the flow of resources to other members.
How to Choose the Right Layout Algorithm
Choosing the best layout algorithm depends on your network’s structure and your goals:
- Exploring general dynamics? Start with CoSE or fCoSE for a natural, balanced look.
- Presenting hierarchical relationships? Use Breadth-First to showcase levels of influence.
- Highlighting attributes or equality? Go with Grid or Circle layouts.
- Customizing a complex map? Opt for D3-Force if you’re comfortable tweaking parameters.
Picking a Layout Algorithm in PARTNER CPRM
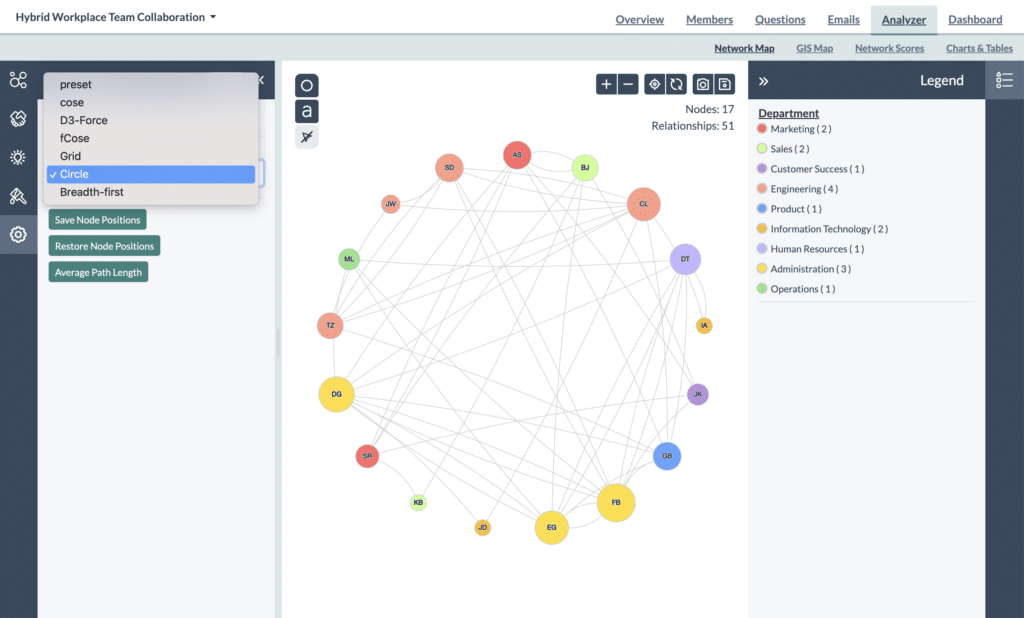
Within the Analyzer Network Map, click the “gear” icon on the left panel to open your visualization settings. Click the dropdown menu to choose one of the six available options in PARTNER CPRM:
- CoSE
- F-CoSE
- D3-Force
- Grid
- Circle
- Breadth-first
Different algorithms work better for different types of networks and purposes.
PLEASE NOTE: Not all layout options work for larger network maps with more than 100 nodes. Stick to CoSE, FCoSE, D3-Force, or Circle for large network maps and visualizations.
Experiment and Discover Insights
One of the most powerful features of PARTNER CPRM is the ability to experiment with different layouts. Try switching between algorithms to see how they reveal different aspects of your network. You might find that one layout highlights clusters, while another makes key connectors stand out.
With the right layout, your network map becomes more than a visualization—it becomes a tool for insight, strategy, and storytelling. Ready to dive in? Log into PARTNER CPRM and start exploring today!
Need Help?
Our team at Visible Network Labs is here to support you. If you have questions about layout algorithms or want guidance on analyzing your network, contact us anytime. Together, we can unlock the full potential of your network.
