Dashboard Builder
Share Your Findings with Interactive Dashboards and PDF Reports
Easily Turn Your Visualizations Into Dynamic Dashboards to Share Insights
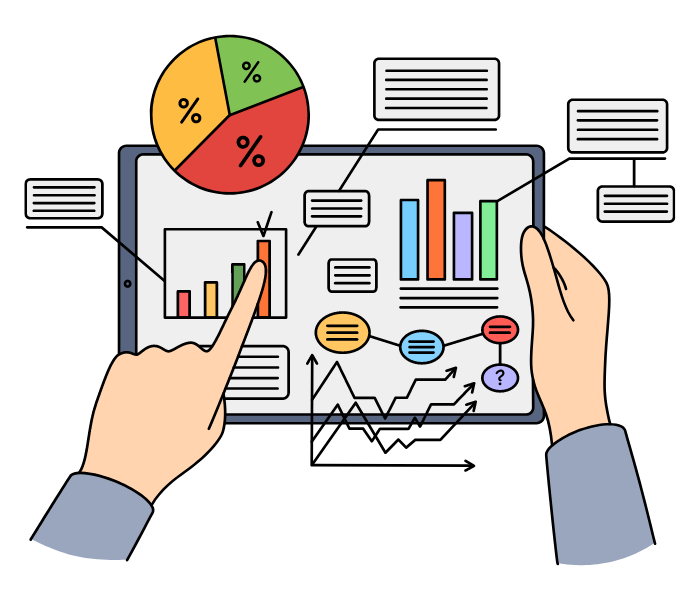
Democratize your data and give it back to your community partners and stakeholders by creating dynamic dashboards and PDF reports in PARTNER. Add saved visualizations with additional text on your interpretation and analysis and share them with a link or as a static PDF report you can print or email.

Dashboard and Report Features
Each feature is designed to help you share your data, visualizations, and insights with your community partners and stakeholders.
Create a Custom Layout
Use blocks and columns to layout your data and dashboard however you want.
Multiple Sharing Options
Download it as a static PDF report or share a link to a live, interactive dashboard
Choose the Right Privacy Level
Choose who can see which dashboards and whether they can access profiles.
With PARTNER, It's Easy to Share Data with the Community
Providing access to your data and insights builds the entire community’s capacity to develop data-driven network strategies for collaboration. With PARTNER CPRM, it’s easy to create and share live interactive dashboards with your network maps, charts, and findings with the community. Share access with a link or download them as static PDF reports to print or email.
Data Dashboard Top Benefits
- Add visualizations, maps, and charts saved from the analyzer.
- Share insights and data with the community to build capacity.
- Customize your layout and data to tell your unique network story.

Success Stories


